It really does feel like being in the jungle lately.
After the FTX debacle, the crypto market felt to me more like Lord of the Flies all over again than the orderly and efficient markets I had come to know and rely on. The aftermath of the SBF fraud deprived many market makers, hedge funds, and other large traders of tens of billions of dollars of their own working capital.
This capital could have been deployed and traded aggressively during this wild price swing.
So what are the consequences of the absence of capital?
This market is rapidly escalating into a full blown, unrestricted, player-to-player trading environment.
Earlier this week I had the opportunity to sit down with Mr. Benjamin, Chief Quantitative Analyst at Jarvis, and he walked me through some of the intricacies going on in this post-apocalyptic market.
Just as there is a predator and prey in a normal jungle, there are predators and prey in cryptocurrency exchanges, Benjamin explained.
There is perhaps no better tool to monitor this ever-changing PvP (player-to-player) dynamic in real-time than looking at liquidation and order flow data.
Today, let’s take a look at Jumanji in the crypto space.
hunt for liquidity
When markets become as illiquid as they are now, prices are more prone to wild swings and manipulation.
Because of this, market makers and other well-informed large traders (predators) who are not affected by FTX are able to reap greater benefits. This is because illiquid markets work in their favor by using less liquidity, increasing their ability to influence prices.
For example, an order to buy or sell millions of dollars worth of Bitcoin in a healthy, liquid market won't have much lasting effect, but in an illiquid market, at the right time, Delivering a large order to a thin order book can create extreme price volatility, liquidating leveraged traders.
When these liquidations occur, it forces predatory traders (often overleveraged retail investors) to exit positions at inopportune times.
Basically, they sell low during a crash and buy high during a short squeeze. This forced buying and selling creates volatility that can be very profitable for skilled predators. This is also why this type of activity occurs when spot volumes are low - mostly derivatives.
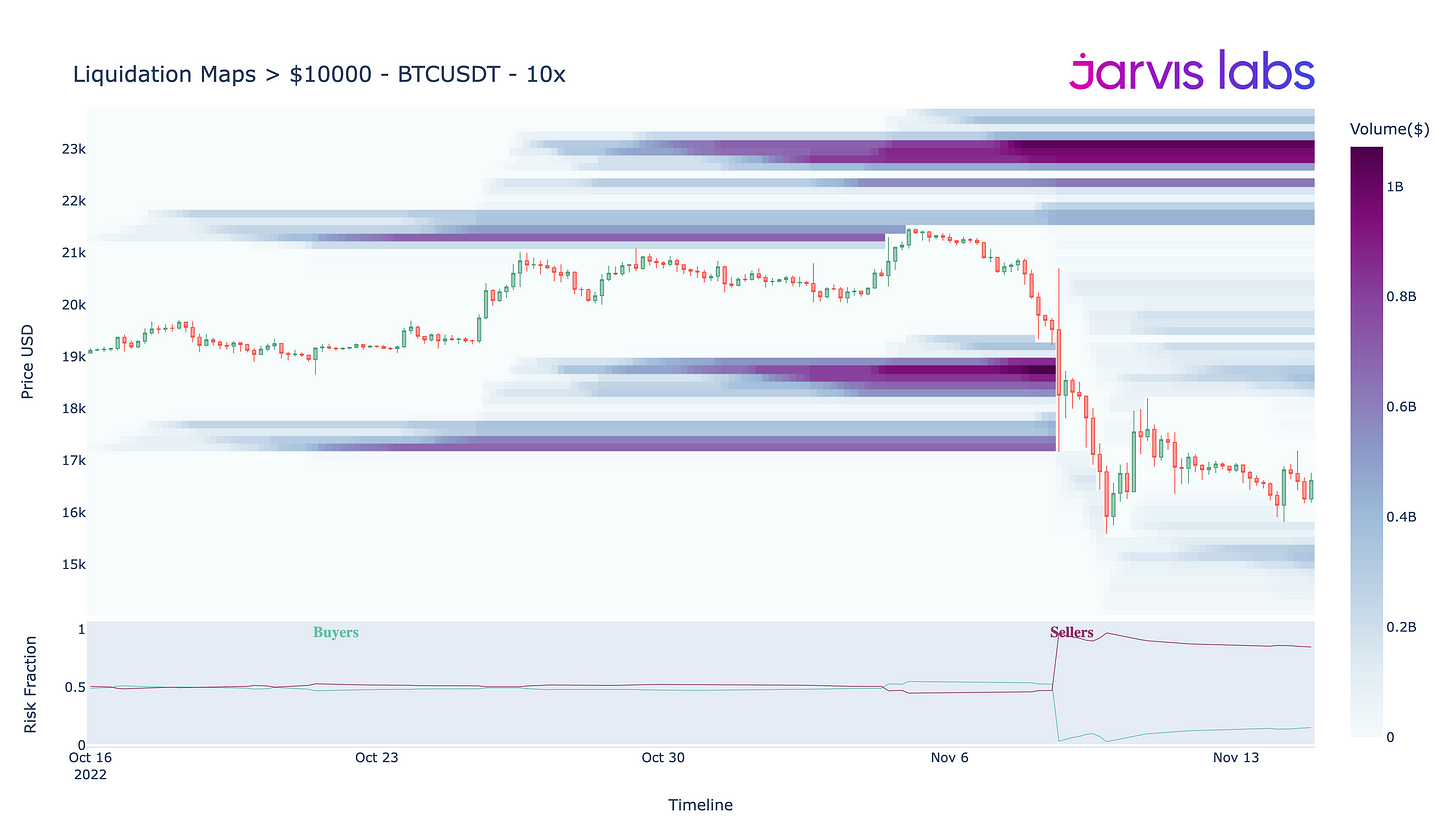
The figure below shows the cumulative liquidation pool of BTC/USDT, which comes from users trading contracts worth more than $10,000 with leverage greater than 5 times.
If you recall last week, just after the news of FTX’s bankruptcy broke, the Predators smelled blood and dumped their Bitcoin, driving the Bitcoin price down below $20,000.
This escalated into a sentiment-driven sell-off that thinned the order book, resulting in the liquidation of over $1 billion worth of leveraged long positions between $18,000 and $16,000. You can see that the price plummeted, and the lowest price sucked out all the liquidity in one fell swoop.
Once these massive pools of liquidity have been ransacked, prices will stabilize.
What we're seeing now is long liquidity pools forming below $15,000 (worth ~$500M), but much larger short liquidity pools totaling billions of dollars (larger than what was liquidated last week) at $21,000 and up.
This means that short liquidity is a much bigger target for predators right now.
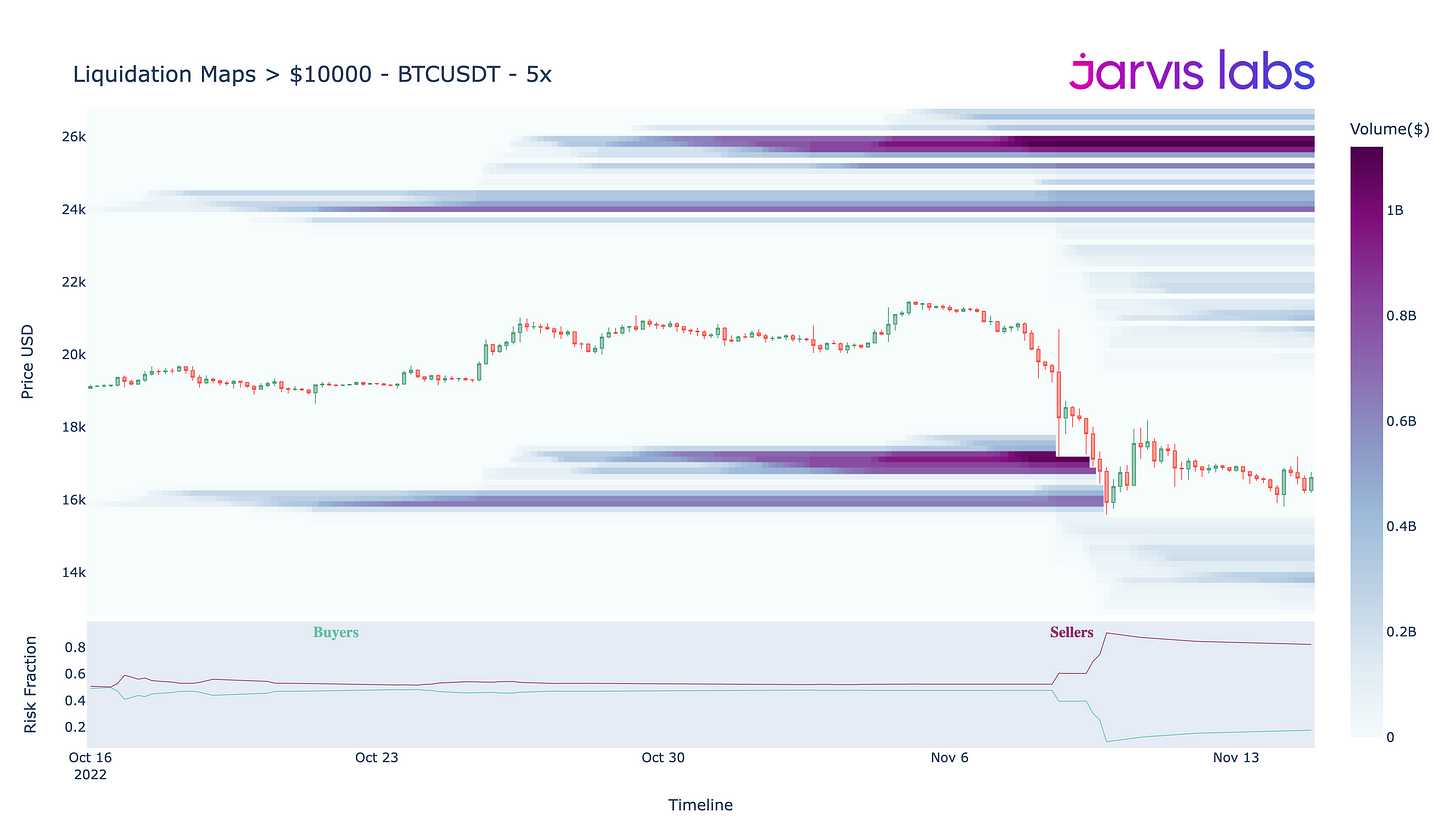
We can also see this in BTC’s 5x chart, showing that additional short squeeze bonuses above $20,000 total billions.
If prices start to gain momentum, be aware that these levels are target points for future short squeezes.
However, also note the smaller pools that started to form in the 14000-15000 range on both charts. If the value of these liquidity pools increases, or if prices fall below last week's lows, leveraged long positions could soon be in danger of another major liquidation.
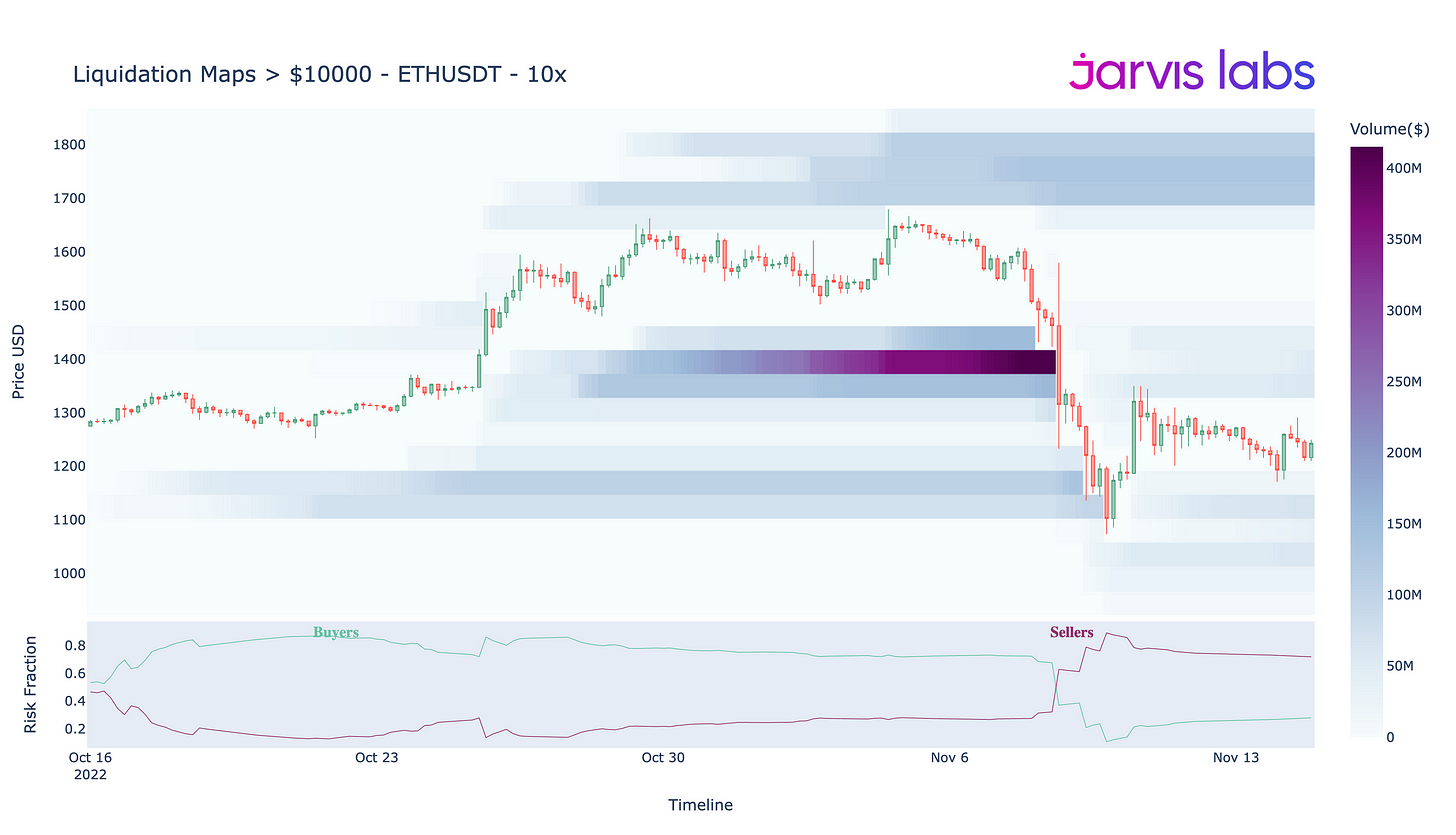
The liquidation graph for ETH looks largely similar, with smaller liquidity pools on both sides, but sellers seem to be at greater risk of being squeezed than buyers at the moment.
After these liquidity charts, and before any short or bull squeezes unfold, the next most important factor in identifying them is order flow, Benjamin explained.
Through order flow, we can better understand who is selling, how much is selling, and at what price. Usually, this gives us time to react before big changes happen.
With this in mind, let's take a look at a tool we use called CVD that can help us stay one step ahead of predators.
track footprint
In order to tap into these liquidity pools and start a short squeeze, large investors will need to step in and push prices higher against the current waves of capitulation.
As we mentioned in last week’s article, all BTC holders were net sellers except those with less than 10 BTC (retail) and more than 10,000 BTC (whales), and over the past 30 A total of more than 60,000 BTC ($1 billion+) in one day, and they show no signs of stopping the sell-off.
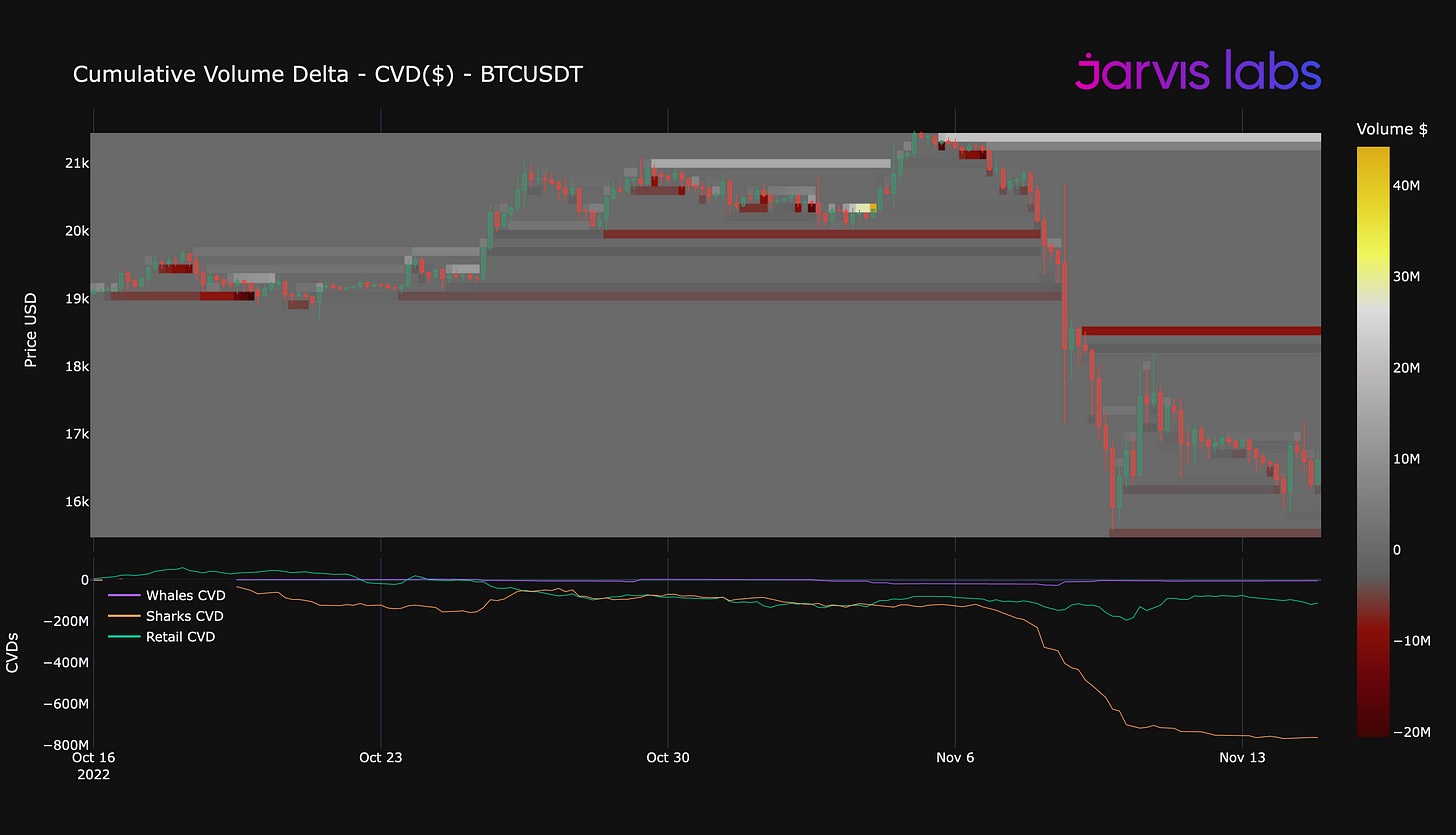
The graph below shows Bitcoin’s total volume delta (CVD), which gives us an idea of which types of market participants are buying and selling, and at what level.
We can divide them into three categories:
- Whale = 10000 + BTC
- Shark = 10 - 9999 BTC
- Retail investors = less than 10 BTC
The cumulative buying and selling of the three groups is reflected in the subgraph at the bottom of the figure below. The brown line has been falling, showing that the sharks are eager to get out of the market at almost any price.
The large red line just below $19,000 in the candlesticks in the upper half of the chart shows an area where there is a remaining sell order. It is currently worth more than twenty million dollars. This means that this price range will act as a key resistance point for buyers to retake, which in turn will instigate a squeeze.
If they do, watch out for the increased likelihood that prices will move higher quickly.
Watch the price react if it hits that range next week, this resistance flip could trigger a rally towards the end of the month.
Conversely, if the price starts to gain acceptance below $16,000, rather than support, which could be the result of further FTX domino falls, then new lows and lower lows for the year could be in play.
In a wild bull market with high liquidity, our spirit animal should be the tiger, always on the prowl, eager to pounce on opportunity.
In a bear market, by contrast, most would be wiser to imitate the vulture. Conserve energy and mobility while watching predators hunt from a distance, then look for opportunities when their mobility hunt is over.
With that in mind, if you're actively trading, recognize this new dynamic and only store funds on reputable exchanges...there's a jungle out there.
 JinseFinance


