About the author: Ben Giove is an analyst at Bankless, former president of Chapman Crypto and an analyst for the Blockchain Education Network (BEN) crypto fund.
Source: Bankless (The key analysis of this article comes from James Wang's " Ethereum Announces 2021 Q1 Results ")
This report examines the metrics of the Ethereum protocol and ecosystem for the second quarter of 2022 (ending June 30) and is divided into four sections: Protocol, DeFi, NFT, and Layer 2.
Next, we will focus on the highlights and future prospects of the ecosystem.
key result
The data compares performance in the second quarter of 2021 and the second quarter of 2022.
protocol
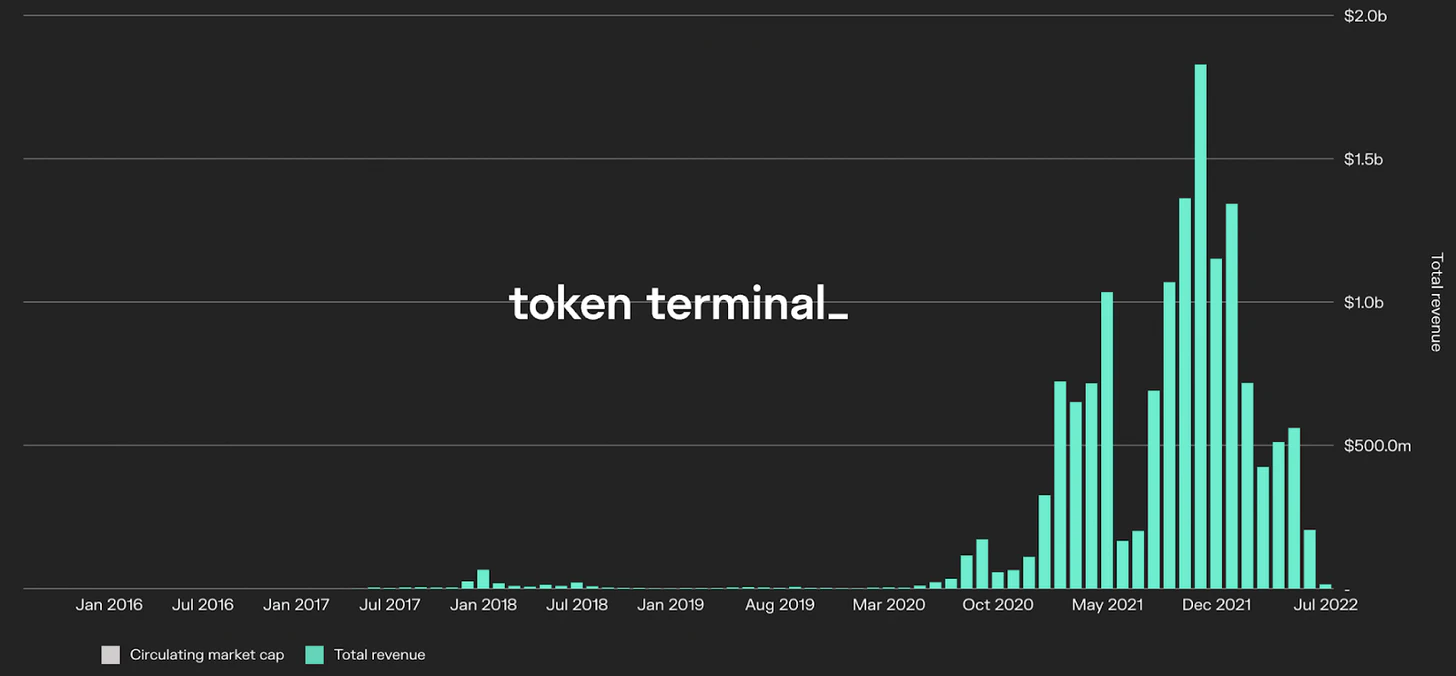
Ethereum Network Revenue - Source: Token Terminal
Network revenue fell 33.4%, to $1.28 billion from $1.91 billion.
This metric measures the value of transaction fees paid to use the network. Of this, $1.09 billion in ETH (85.4%) was burned and removed from circulating supply.
The decline in block space demand may be due to market weakness during the quarter that dampened speculation.
ETH inflation dropped 37%, from 1.12% to 0.71%
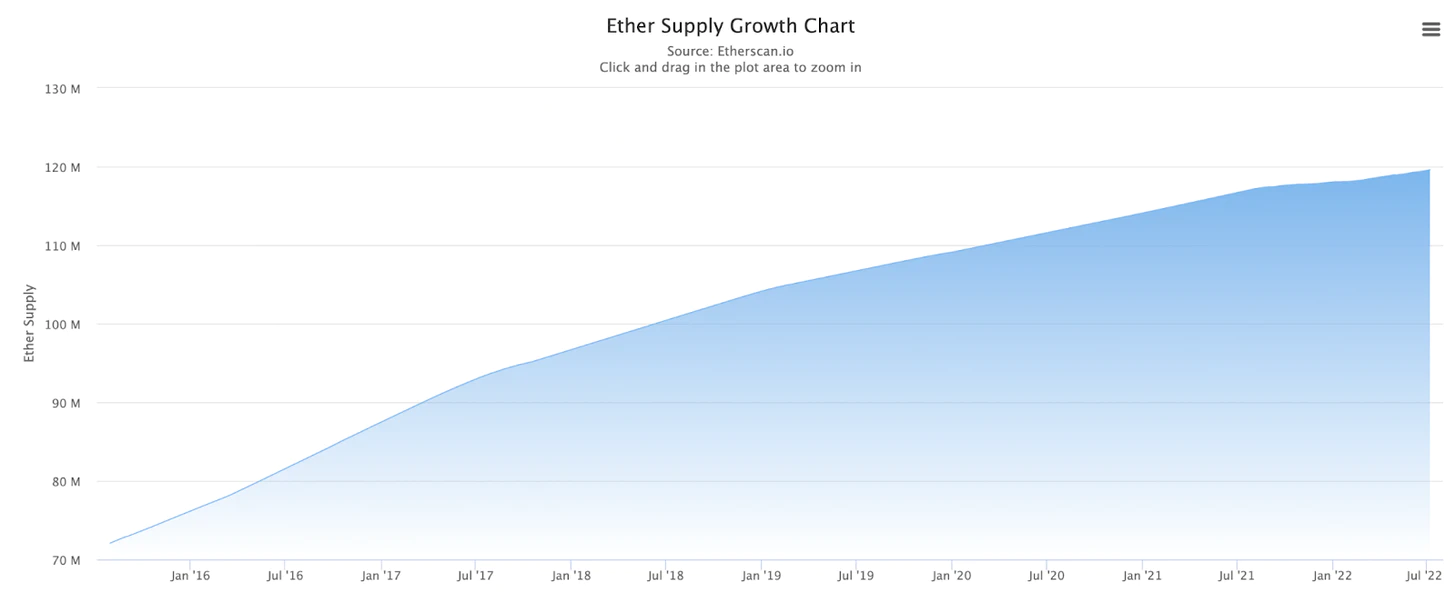
ETH Supply Growth - Source: Etherscan
This metric measures the supply growth of ETH during the quarter.
The drop could be due to the fee burn mechanism implemented through EIP-1559 in Q3 2021.
The average number of daily active addresses fell 20.6%, from 593,404 to 471,447.
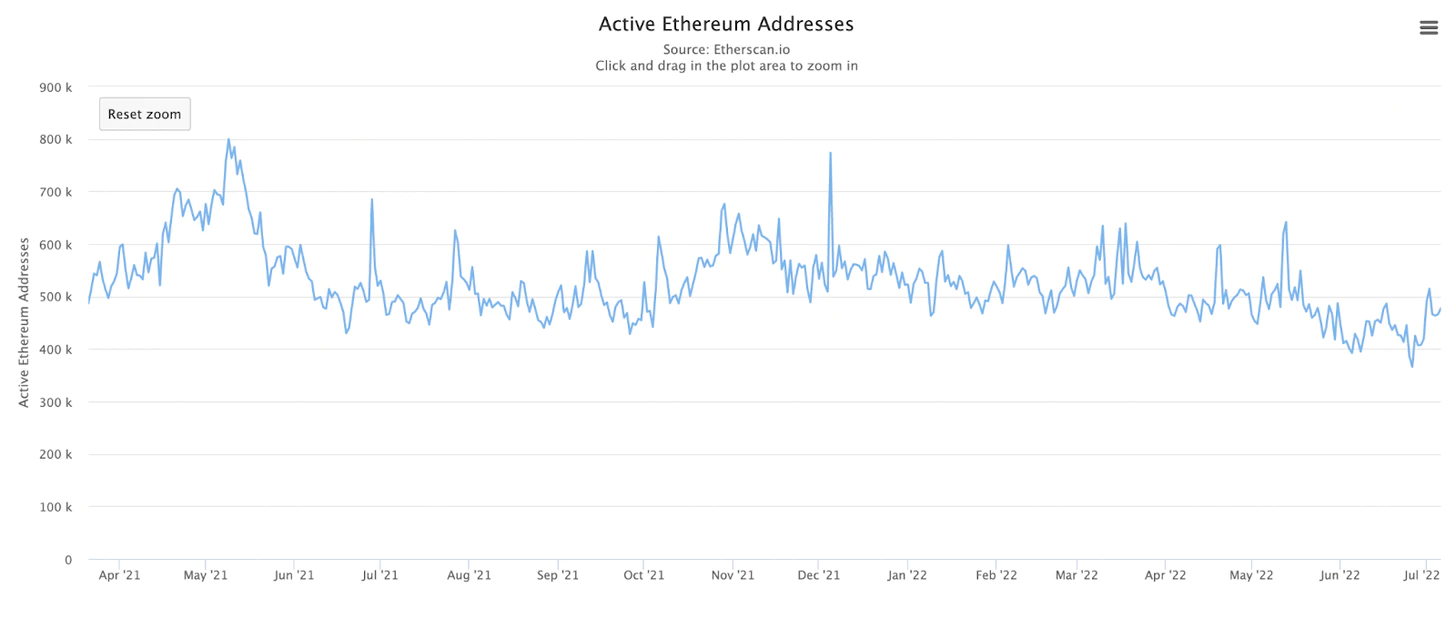
Ethereum Daily Active Addresses - Source: Etherscan
The metric tracks the average number of wallet addresses conducting transactions on Ethereum per day during the quarter.
As with network revenue, the decline could be due to a decline in speculative appetite among users amid a bearish backdrop for the quarter.
Staked ETH increased by 116%, from 6.01 million to 12.98 million
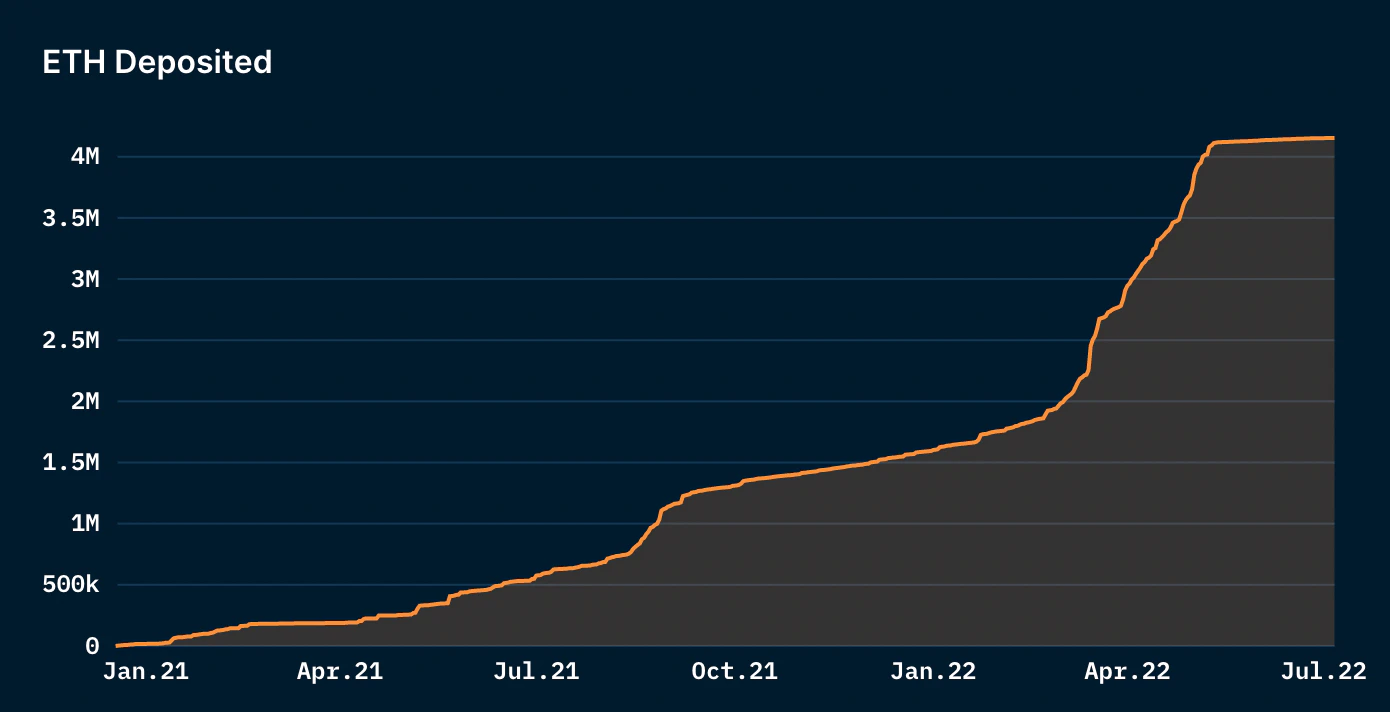
ETH stored on the Beacon Chain - Source: Nansen
This metric measures the amount of ETH staked on the beacon chain before the network is about to transition from proof-of-work (PoW) to proof-of-stake (PoS).
As of the end of the second quarter, the number of pledges accounted for approximately 10.86% of the total supply of ETH.
DeFi Ecosystem
DeFi TVL fell 42.4%, from $59.42 billion to $34.21 billion.
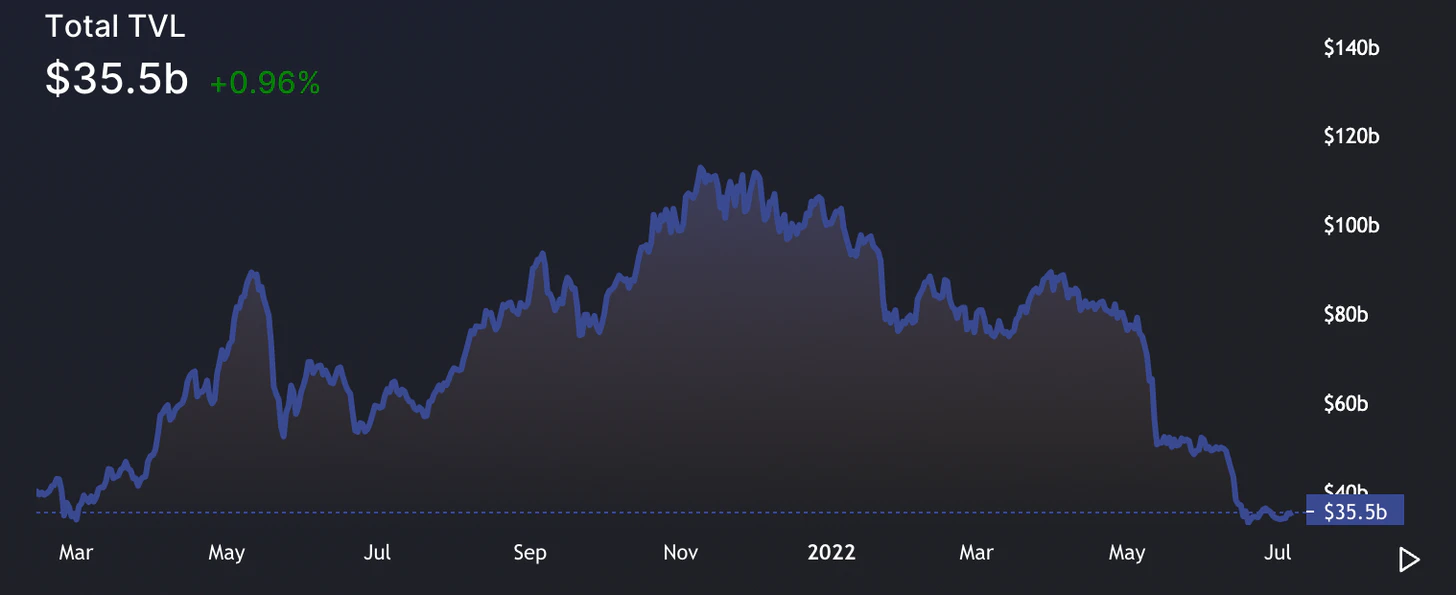
Ethereum DeFi TVL - Source: DeFi Llama
The metric tracks the value of assets deposited in DeFi protocols deployed on Ethereum.
The reason for the decline may be the decline in the price of encrypted assets this quarter, as well as the liquidity outflow caused by the compression of yields, and the decline in the risk appetite of DeFi users.
The circulating supply of stablecoins increased by 43.0%, from $76.58 billion to $109.5 billion.
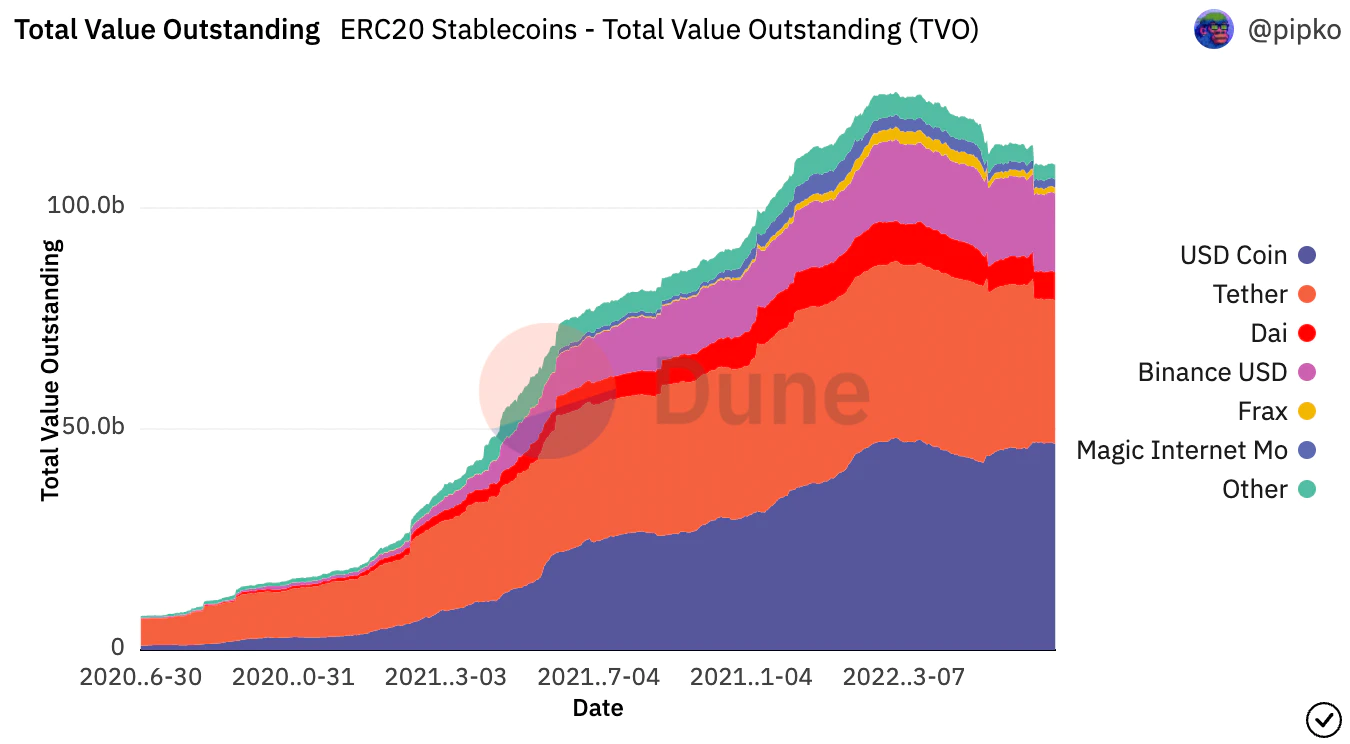
Circulating Supply of Stablecoins - Source: Dune Analytics
The metric measures the number of dollar-pegged stablecoins issued and in circulation on Ethereum.
The growth can be attributed to the increased demand to trade or leverage stable assets, as well as the growth of newly issued stablecoins such as FRAX.
Spot DEX trading volume fell 9.0%, from $350.54 billion to $319.13 billion.
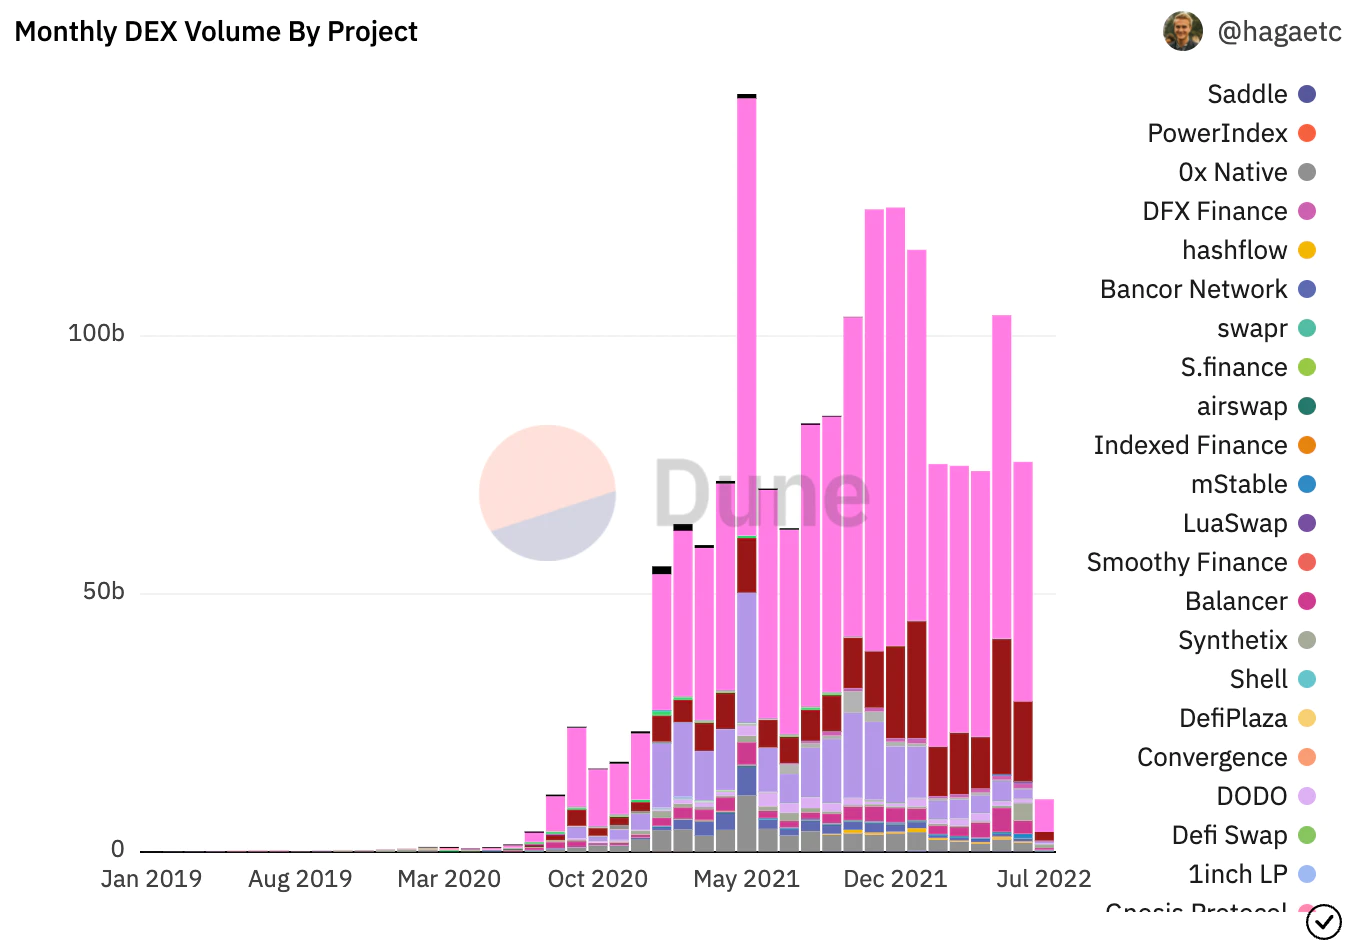
DEX Monthly Trading Volume - Source: Dune Analytics
The metric measures the total trading volume of decentralized spot exchanges on Ethereum during the quarter.
The drop in spot trading volume could be due to market conditions, as trading volume has been highly correlated with bullish price action.
The trading volume of perpetual contract DEX increased by 598.5%, from $19.39 billion to $135.48 billion.
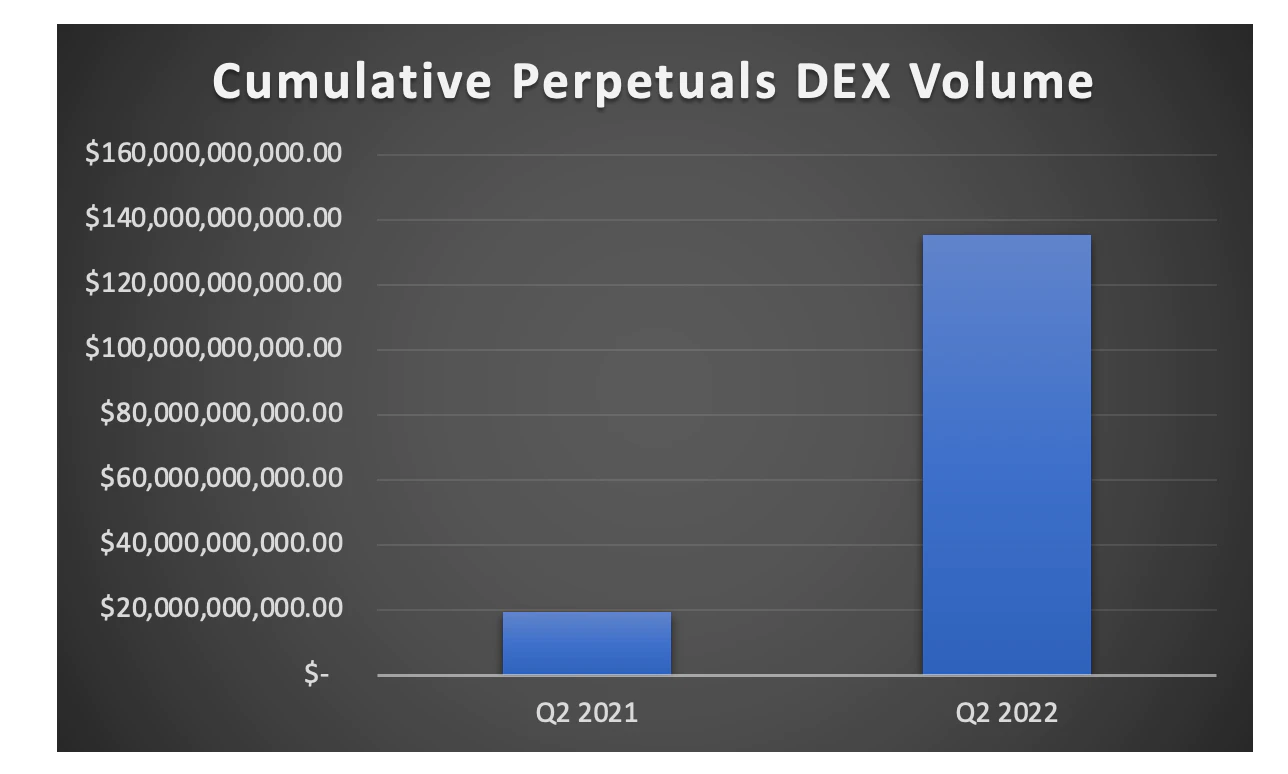
Perpetual Contract DEX Quarterly Trading Volume - Source: Token Terminal and GMX Analytics
The rise in perpetual contract volume can be attributed to the growth of dYdX, which saw a 598.4% year-over-year increase in volume.
Note: Perpetual contract DEX trading volume tracks trading volume from dYdX, Perpetual Protocol, and GMX.
The liquid pledged share of deposits increased by 177.5%, from 12.0% to 33.3%.
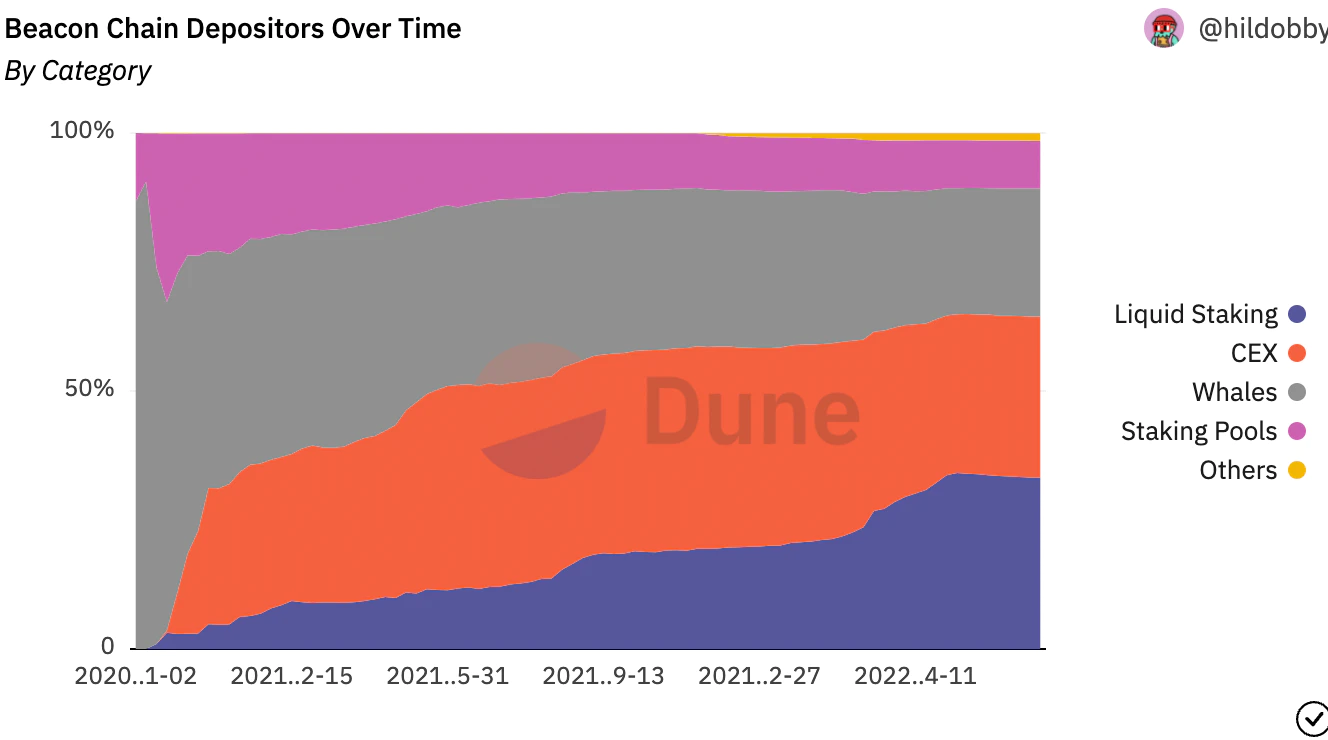
Beacon Chain Deposit Types Market Share Breakdown Source: Dune Analytics
This metric measures the share of ETH pledged by non-custodial protocols that issue Liquid Staking Derivatives (LSDs).
The increase could be due to an increase in ETH staked on the Beacon Chain in Q1, as well as increased integration of LSDs (like Lido’s stETH) with different DeFI protocols.
NFT ecosystem
The trading volume of the NFT market soared from $509.36 million to $12.93 billion, an increase of 2439.2%.
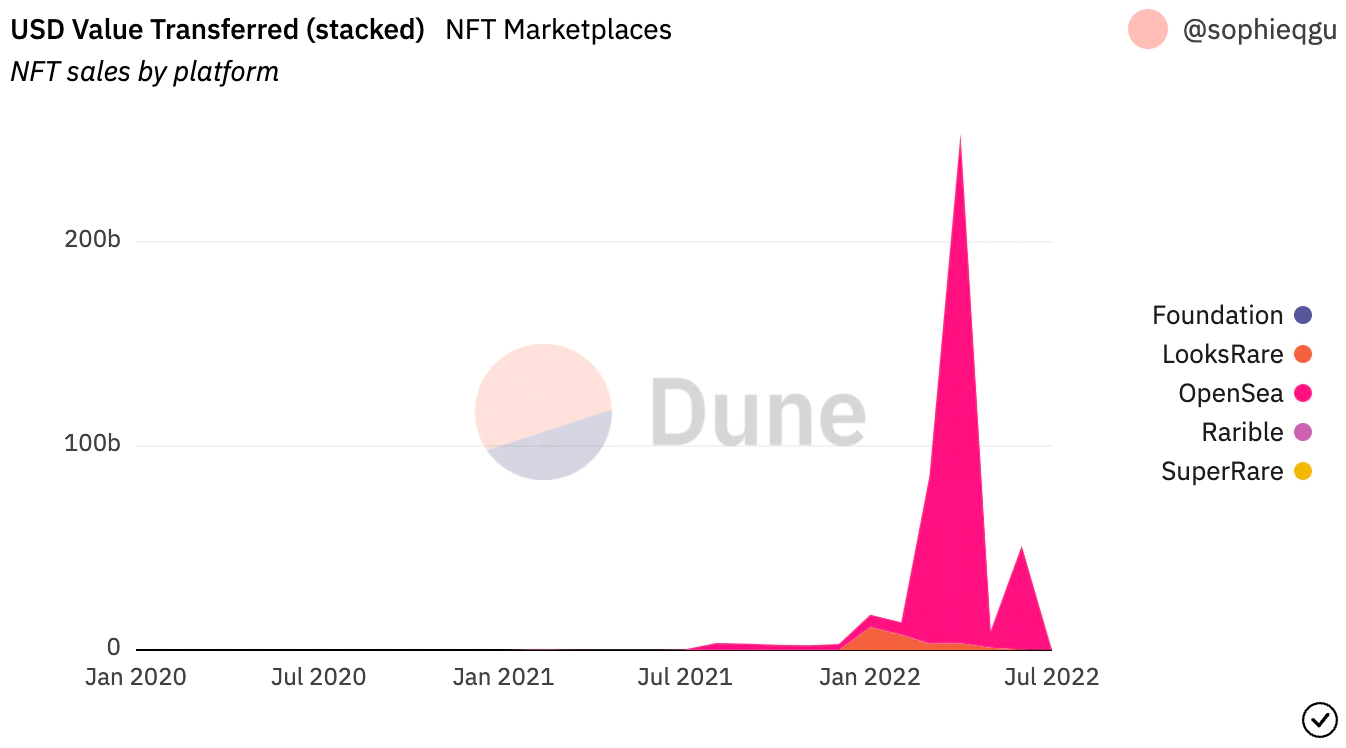
NFT Market Sales - Source: Dune Analytics
The indicator tracks trading activity on the OpenSea, Foundation, LooksRare, Rarible and Superrare marketplaces.
The growth may be due to the long-term growth of the NFT ecosystem between the second quarter of 2021 and the second quarter of 2022, especially the rising popularity of the PFP series.
The average number of daily NFT traders grew from 2,412 to 29,289, an increase of 1,114.5%.
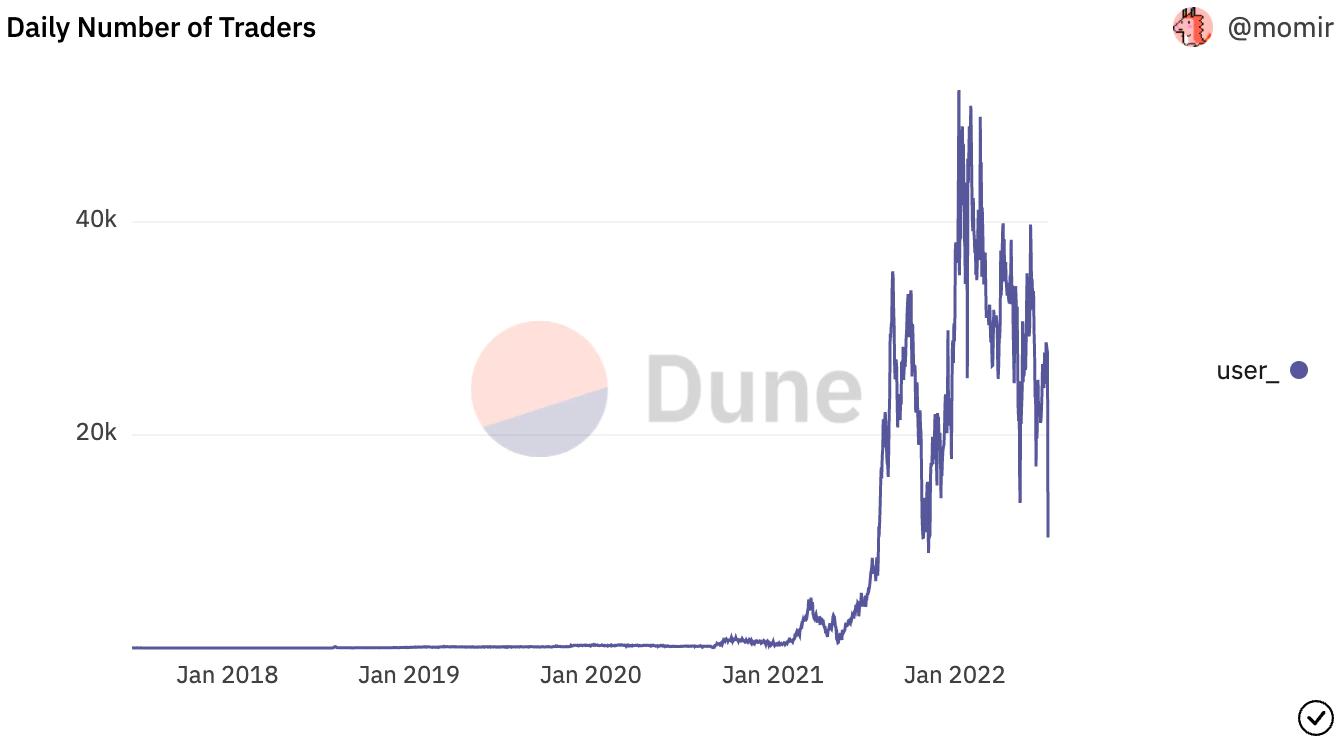
Daily Number of NFT Traders - Source: Dune Analytics
This metric measures the average number of users trading NFTs per day during the quarter.
Like market volume, growth in this metric may be a result of the long-term growth of the NFT ecosystem.
The Bored Ape Yacht Club (BAYC) floor price surged 3844% - from 2.50 ETH to 98.60 ETH.
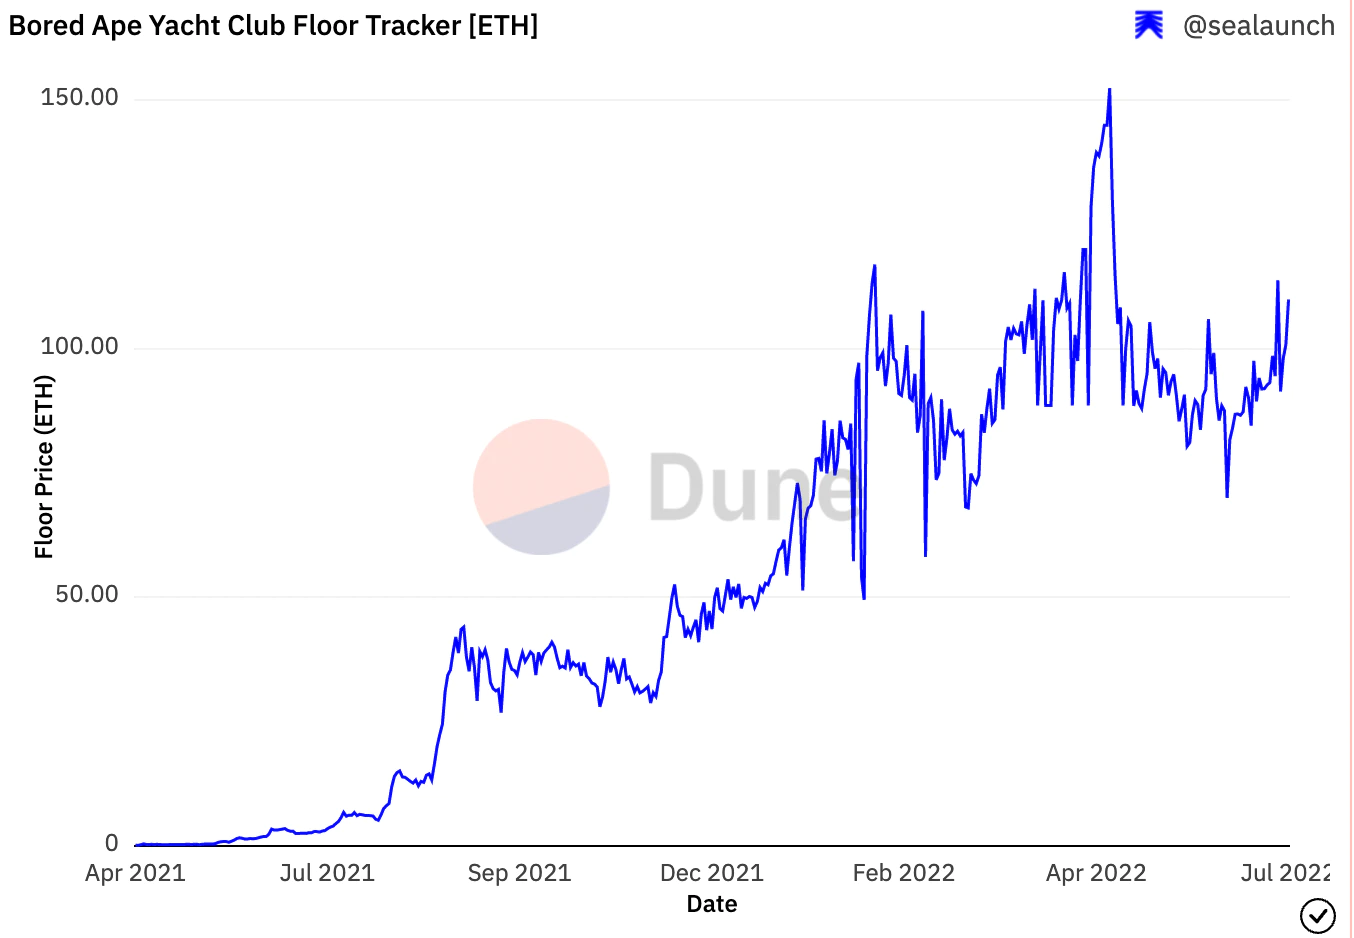
BAYC Floor Price (ETH) - Source: Dune Analytics
This growth is likely due to the growing popularity of PFP NFTs and the increasing adoption of BAYC by various celebrities and well-known public figures.
L2 Ecosystem
L2's TVL increased 896% from $374.17 million to $3.72 billion.
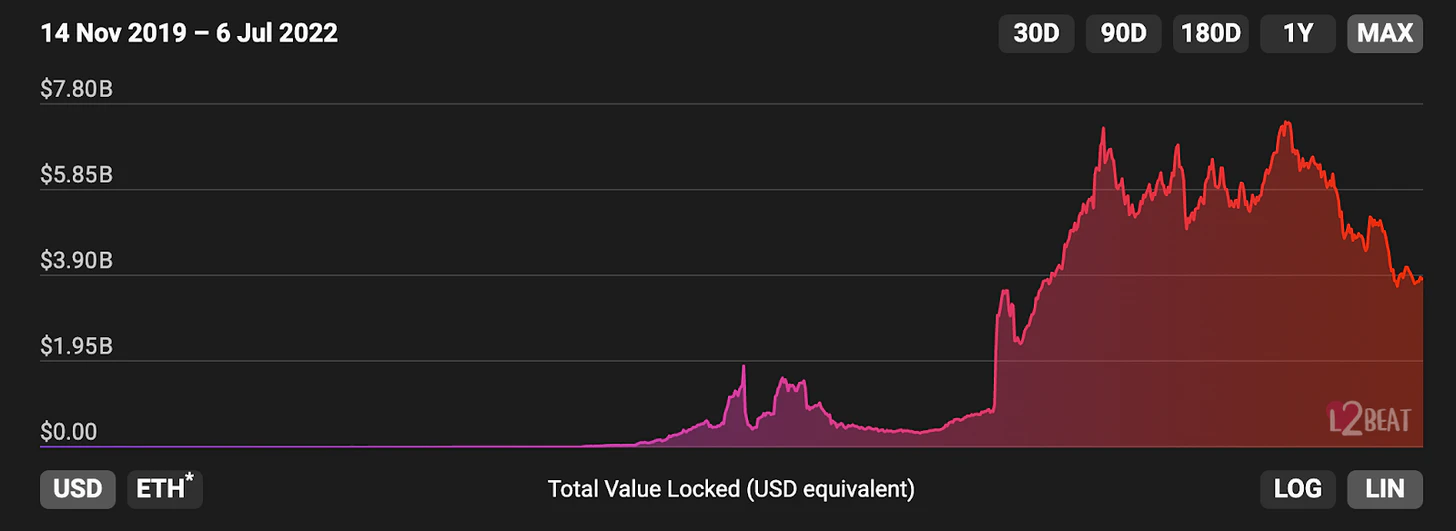
Ethereum L2 TVL - Source: L2Beat
This metric measures the value that has been bridged into the Ethereum L2 ecosystem, with growth likely driven by increased usage, liquidity and application deployments to networks such as Arbitrum and Optimism.
Arbitrum Network’s revenue hit $8.2 million. Optimism had revenue of $5.58 million.

Arbitrum Network Revenue - Source: Cryptofees.info
This metric tracks the value of fees paid by users to transact on L2.
Optimism has an average monthly active user of 175,700. The total number of accumulated addresses on Arbitrum reaches——
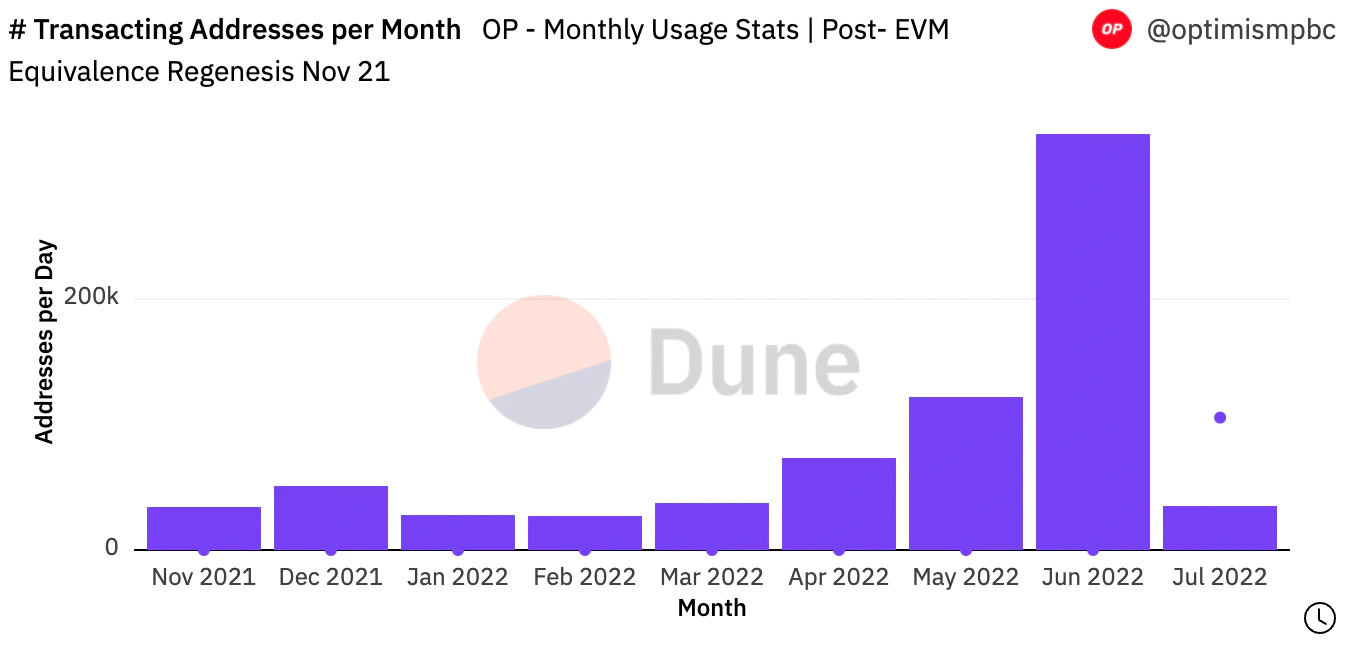
The metric measures the average number of users interacting with Optimism each month during the quarter, and the total number of individual addresses on Arbitrum.
Note: Given that both Aribtrum and Optimism are launching in Q3 2021, and due to limited publicly available data for both networks, we are unable to perform a Y/Y (year-over-year) comparison.
Ecosystem Highlights
DeFi proves its resilience
Despite declining TVL and slowing spot volumes, the Ethereum DeFi ecosystem continued to prove its resilience by withstanding considerable stress tests throughout Q2.
The major turmoil began with the implosion of UST in May 2022, which at its peak was the third largest stablecoin with a market capitalization of approximately $18.78 billion. While the on-chain damage was largely limited to the Terra blockchain itself, the fallout from UST's collapse spread to the broader crypto industry, with the market down 45%.
This led to the collapse of numerous CeFi entities. Overleveraged hedge fund Three Arrows Capital and lending platform Voyager are both locked in bankruptcy battles. The domino effect has put considerable pressure on other lenders such as Celsius and BlockFi, which has been acquired by FTX.
Although CeFi has been hit hard, DeFi on Ethereum has weathered the storm smoothly.
The three largest lending protocols Compound, Aave, and Maker successfully processed $462.25 million in liquidations, continue to operate at 100% uptime, and currently have negligible bad debt.
Interestingly, the transparent nature of DeFi protocols allows market participants to monitor the positions of entities such as Celsius, and analysts on Twitter issued advance warnings about the financial instability of lenders.
While liquidity may have dried up and activity slowed during this bear market, the value proposition of an on-chain financial system has never been more clear than in Q2.
NFT is still hot
Ethereum's NFT ecosystem will remain hot throughout 2022.
NFT prices peaked in the second quarter, with Nansen’s Blue Chip-10 Index — a market-cap-weighted index that tracks the ten largest series by market capitalization — hitting an all-time high on May 2.
Meanwhile, land sales of the upcoming Metaverse Otherside from Yuga Labs, the company behind the Bored Ape Yacht Club (BAYC) and the largest component of the top 10 NFT collections, amounted to $317 million.
This transaction caused massive congestion on Ethereum, leading to new highs in gas prices (and ETH burns).
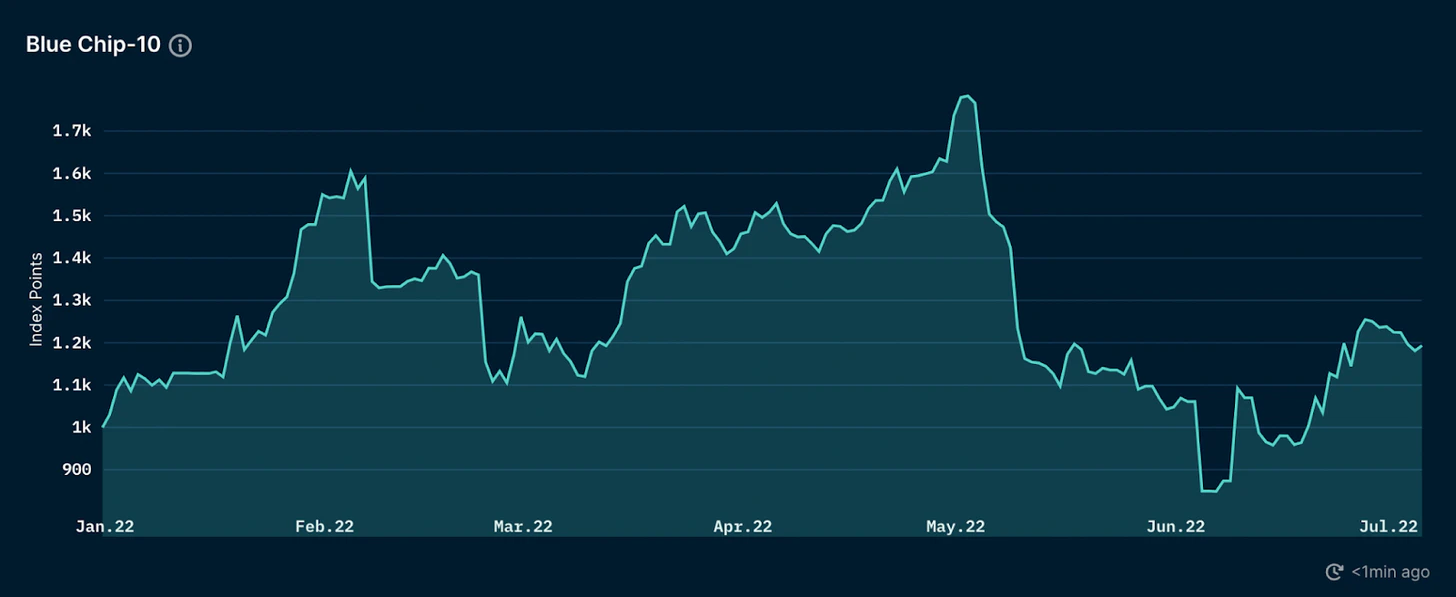
Nansen Blue Chip-10 - Source: Nansen
Another series that rose to fame in the second quarter, Goblintown. The free cast series has skyrocketed in popularity after going viral on twitter spaces. People with this PFP spent hours creating a buzz for Goblin. Goblintown's floor price reached 7.1 ETH within a few weeks.
The NFT space also saw several notable acquisitions and protocol launches in the second quarter. This includes the acquisitions of NFT aggregators Genie and Gem by Uniswap Labs and OpenSea, respectively. OpenSea also announced the launch of Seaport, its decentralized marketplace protocol.
L2 Token Season Begins
Ethereum’s L2 ecosystem has passed one of its most important milestones with the launch of Optimism’s governance token, OP.
Optimism is the first of the “Big Four” rollups to launch a token that OP will use to manage the “Token House” as part of the Optimism governance system. The model enables holders to vote on network upgrades and distribution of ecosystem incentives. In the future, the token may also be used for decentralization and to accumulate revenue from the sequencer (the entity responsible for batching transactions to L1, currently operated solely by Optimism PBC).
While the airdrop process is problematic, the OP has demonstrated the potential that L2 tokens hold to drive increased interest, usage, and activity on the network.
Since its launch, Optimism’s share of DeFi TVL has grown from 17.26% to 30.42%.
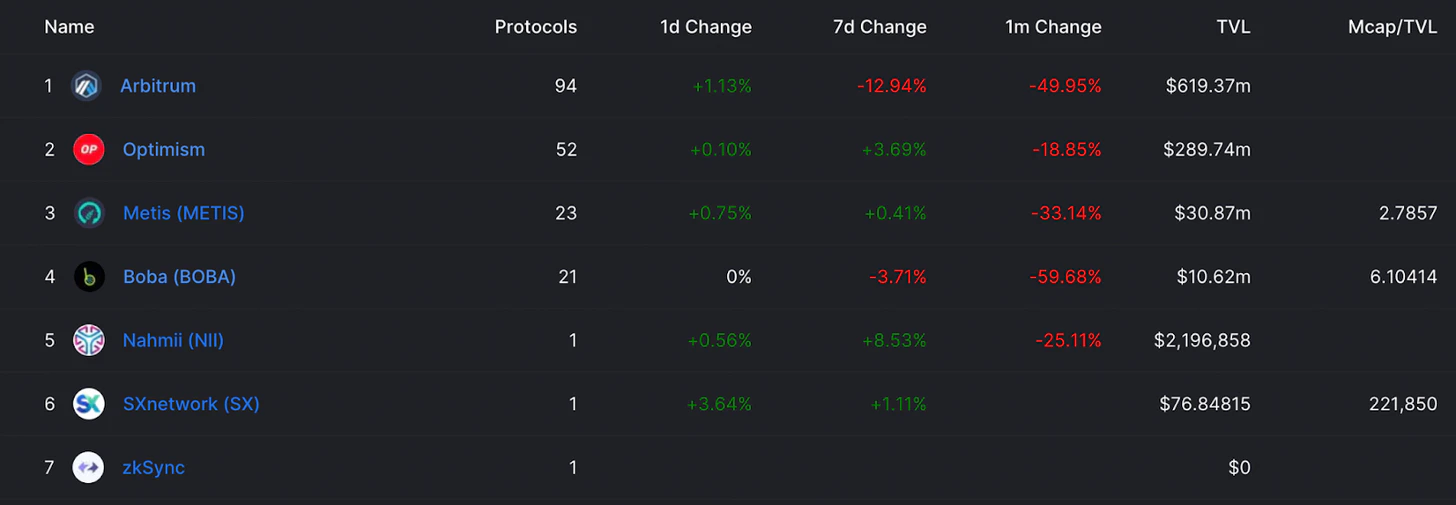
DeFi TVL on the L2 Network - Source: DeFi Llama
In another notable token announcement, Immutable-X, a gaming-focused L2 built using StarkEx, announced that it plans to start dedicating a portion of “protocol fees” to its IMX token. Once protocol fees are activated, holders will be able to earn 0.8% of all primary and secondary NFT sales on the network.
Recently, Arbitrum launched its Arbitrum Odyssey campaign, which aims to guide usage of popular applications on the network while rewarding participants with NFTs. The event was postponed until after the Arbitrum Nitro upgrade was complete due to a surge in gas fees due to an all-time high number of transactions.
Despite some hiccups, the inevitable launch of the Arbitrum token — and Optimism’s forthcoming incentive program — should help increase L2 usage and accelerate user migration away from Ethereum.
Currently, only 0.40% and 0.22% of L1 addresses use Arbitrum and Optimism respectively. A lot has happened on this front, and there is incredible room for growth ahead.
Ethereum’s long-awaited transition from PoW to PoS appears to be finally complete. The merger of the Ropsten and Sepolia testnets has been successfully completed, leaving only Goerli as the last testnet before the mainnet launch.
There are many reasons why the merger represents the most important event in the history of Ethereum, which has been stated countless times, but it is still worth repeating.
We know that PoS Ethereum can complete scalability upgrades, such as the deployment of EIP-4488 and EIP-4844, which will reduce the cost of L2 call data storage and realize Danksharding. Additionally, it will implement the Proposer/Builder Separation Scheme (PBS), which aims to separate block building from block validation to mitigate negative externalities of MEV.

ETH circulation after merger Source - Ultrasound.money
The merger will undoubtedly be a huge bullish catalyst for the ETH asset. Based on the current amount of ETH staked, the issuance required to secure the network post-merger is expected to drop by ~89% from ~5.5M ETH to ~600K ETH.
Based on network revenue over the past 30 days (which is the lowest since summer 2021 due to corrections and fee burns), ETH is projected to be net deflationary, with its supply expected to decrease by 0.6%.
Coupled with the fact that upgrading from miners to validators will remove structural selling pressure, this means that the long-term value proposition of ETH will be significantly improved.
increased competition
While many competitors have lost momentum in the bear market, Ethereum and its L2 continue to face significant competition from the alternative ecosystem.
Recently dYdX announced plans to migrate from StarkEx and launch the V4 protocol as its own Cosmos chain, highlighting its competitive strength. As an early adopter of new technologies, the migration of DEX is a validation of the application chain theory and a leading indicator that teams and protocols may follow in its footsteps and pursue higher sovereignty.
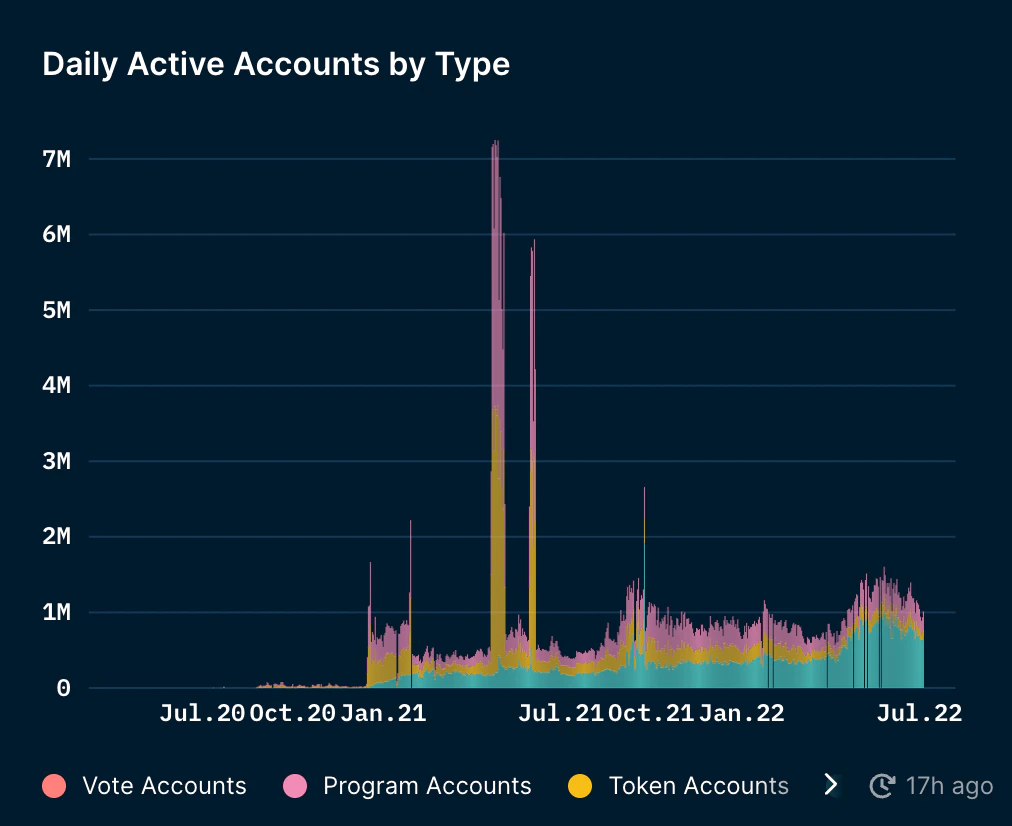
Solana Daily Active Accounts - Source: Nansen
Another network that is putting increasing pressure on Ethereum is Solana. With the rapid development of the NFT ecosystem, the network has the most users in the past 30 days, reaching 20.3 million. Despite the headwinds, Solana continues to execute, grow its user base, and keep developers focused.
As usage increases, L2s such as Optimism and Arbitrum have struggled, and both are experiencing growing pains from implementing new cutting-edge technologies, the door appears to be open for other ecosystems to continue to impose on Ethereum and its network of scaling solutions Competitive pressures are on.
protocol

DeFi ecology

NFT ecology

L2 ecology

About Ethereum
Ethereum is an open source, decentralized blockchain network. Ethereum is the technological home of digital currencies, global payments and applications. The community has built a thriving digital economy, empowered creators with bold new ways to make money online, and more. It's open to everyone, no matter where you are in the world - all you need is the Internet. (Excerpt from the Ethereum.org website.)
About this article: This report is not affiliated with Ethereum or the Ethereum Foundation.
 JinseFinance
 JinseFinance
 JinseFinance
 JinseFinance
 JinseFinance
 fx168news
 Cointelegraph
 链向资讯
链向资讯 Cointelegraph
 Cointelegraph
 Ftftx
Ftftx