Author: Andrew Hong Source: Crypto Data Translation: Shan Ouba, Golden Finance
Memetic coins emerge in every market cycle. If you are not familiar with the concept, think of the craze that the r/wallstreetbets community drove the AMC surge in 2021. A group of people gather around a meme and drive up the price of a certain asset in a short period of time (from one day to a few months). From the blockchain layer to the application layer, this has become a popular marketing strategy in the cryptocurrency field - because it not only increases the price, but also attracts people's attention to the entire ecosystem. Some projects, such as Avalanche, even set up official funds specifically for meme coins.
The line between meme coins and other tokens is sometimes blurred, but the general consensus here is that there is nothing supporting the value of these tokens except the meme itself. For example, DOGE as a token is actually only backed by pictures/ideas of Shiba Inu dogs. This is unlike the ETH token which has the Ethereum blockchain as security, the UNI token which has the entire Uniswap protocol as backing, or the MKR token which has a full collateralized stablecoin service.
Farcaster meme coins (such as DEGEN) are the latest popular type, and their main advantage is that the social features are publicly accessible. Therefore, I wanted to test the waters by doing some basic analysis combining social and financial data.
Social and Financial Metrics Measuring Memecoins
I initially hypothesized that we could compare the social and financial health of all memecoins through a simple chart:
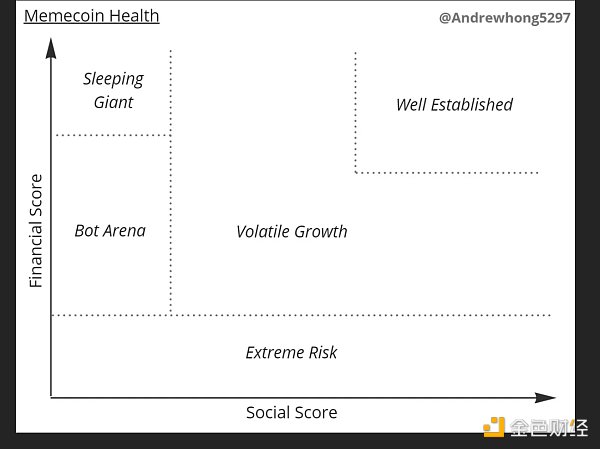
In the chart, I divided memecoins into five main areas:
Extreme Risk: Memecoins with low liquidity and trading volume are at high risk and prone to rug pulls (because there may be only a few liquidity providers)
Bot Battleground: Most memecoins never make it out of the battleground, with thousands of coins (many with the same token name/variations) vying for social and financial attention
Volatile Growth: Memecoins that break out of the initial fold now need to maintain their momentum and growth. You may see big price swings of 100-500% in a few days, and a group of influencers will start to follow the meme.
High Visibility: The leaders will stay ahead socially and financially for a while, and be clearly differentiated from other projects. Weekly data may fluctuate less, and attention will continue as people flow in and out of the market even out.
Sleeping Giants: Memecoins that have seen a lot of growth both socially and financially (and haven't suffered a blanket scam) may stay quiet for a while, staying in this corner. The project may have set up a DAO organization, started to provide some randomly minted tokens or products, and tried to maintain the operation of the community. At the same time, they also hope to attract attention again.
Most meme coins should be stuck in the "bot battlefield" stage, a few attractive projects will enter the "volatile growth" stage, and perhaps only one or two projects can reach the "high visibility" level. In the process, some projects may lose social influence and become "sleeping giants", and others may lose financial support (liquidity) and become "extremely risky".
I believe that successful meme coins usually go through this process:
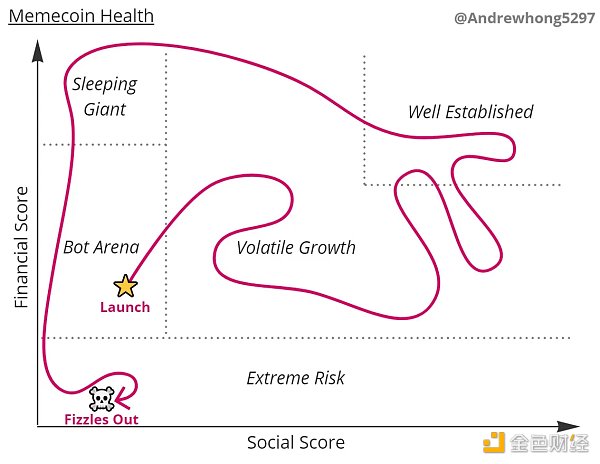
You may see many meme coins that use robots or celebrities to push up social scores but lack financial support (liquidity). Such projects often end up as scams.
After a lot of data sorting and cleaning, I made this chart, focusing on the Farcaster meme coin:
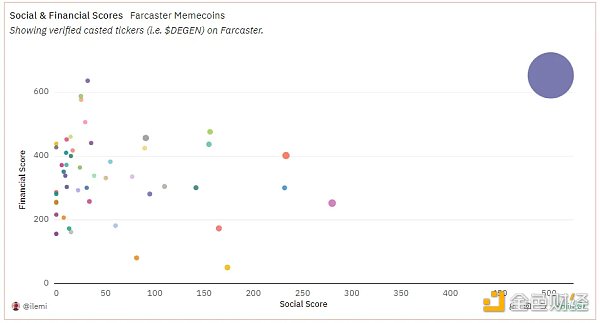
The analysis results are as expected
The results of this chart are indeed as I expected, with DEGEN leading the way in the upper right corner, and then several projects such as ENJOY, HIGHER, TN100X and EVERY in the middle. All other projects are gathered on the left, competing for attention and liquidity.
It is worth noting that I did not filter out fake accounts/bots here, so the social scores of some meme coins may be distorted. This will be a direction for future improvements!
Now, let’s work backwards from the final chart to explain how the two scores were generated. For those who want to dig deeper, I’ll also pose further research questions and detail my lineage of inquiry.
Dune’s dashboard is linked here, along with a few charts I didn’t include in this post.
Social Score
Each score is made up of a “base” component and a “growth” component. For the social score, we start by measuring the number of posts and engagements with mentions of the token symbol. So, under this methodology, “$DEGEN” would count, while just “DEGEN” would not.
This gives us five main columns:
Publishers: The number of people who have posted a given token symbol
Recipients: The percentage of publishers who have ever received that token
Posts: The number of posts containing a given token symbol
Channels: The number of channels containing posts containing a given token symbol
Activity: Engagement (likes + replies) plus post count times the cube root of publishers times the cube root of channels
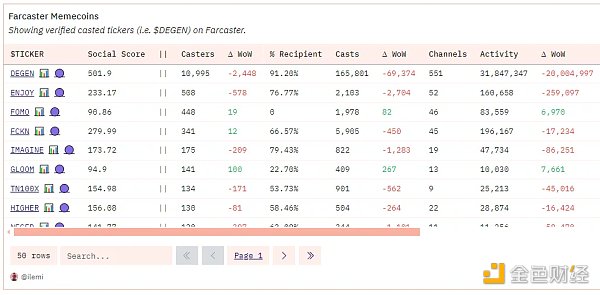
The Social Score is calculated as: A Base of Activity and a Growth multiplier based on the month-over-month change in unique publishers and recipient publishers. The idea here is that if you see a big growth in the number of people posting token symbols and the number of people buying/acquiring tokens, that’s a very healthy sign.
Overall, it looks like this in a table:
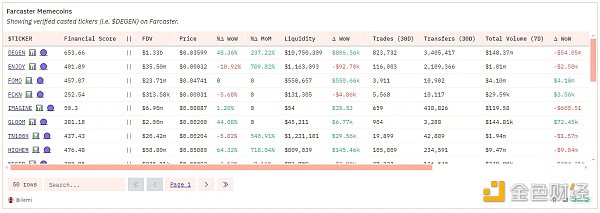
Financial Score
Here are the main financial metric columns:
Fully Diluted Value (FDV): Total Supply multiplied by Price
Price: Latest price based on DEX transactions
Daily/Weekly/Monthly Price Change Percentage: Daily, weekly, and monthly price change percentage
Liquidity: This is non-token liquidity, meaning for one DEGEN-WETH pool, we only count the WETH portion. It can be a more stable indicator of how much good liquidity there is for a given token.
Trades: number of DEX trades in the past 30 days
Transfers: number of erc20 transfers in the past 30 days
Total Volume: total USD volume traded on DEXs in the past 7 days
The "Base" part of the financial score is non-token liquidity and DEX volume, and the "Growth" part is based on month-over-month change in liquidity.
Overall, in a table it looks like this:
Further Research Directions
Here are some questions I’d love to see you delve deeper into:
How to score fake accounts/bots for publishers? Can this be weighted by the USD value of tokens in the wallet? Can publishers be graded based on their relationship to known groups and/or community members?
Categorize social and financial growth waves - how do they relate? Is there a time lag or one-way dependency?
Are the same circles/types of people driving the initial wave of growth? What about those who joined early, joined on time, and missed the meme? Is there a relationship between user levels?
What happens when a meme "rotates" from one to another? What or who drives this?
Does a person's social or financial interest determine his/her level of "interest" in a meme? Do people post more or less after buying/selling tokens?
What is the average lifespan of a meme? How about socially and financially?
 JinseFinance


