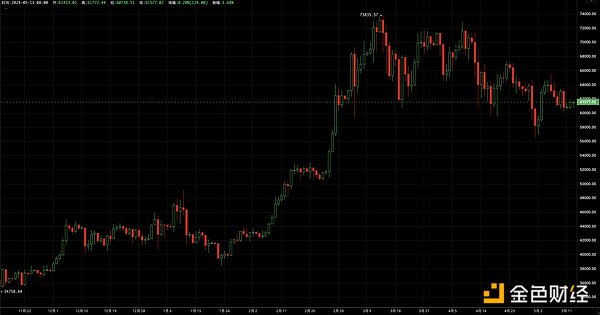
Source: EMC Labs
*The information, opinions and judgments on markets, projects, currencies, etc. mentioned in this report are for reference only and do not constitute any investment advice.

Market Summary:
Although we regard BTC as the ultimate safe-haven asset of supranational sovereignty, it must be admitted that it is still in the stage of risky assets, especially under the direct influence of the US dollar macro policy. Last week, the relatively mild speech of Federal Reserve Chairman Powell caused BTC to rebound to $63,000. But a few days later, because another member of the Federal Reserve emphasized the 2% inflation rate bottom line, it fell to the $60,000 mark.
The 5% fluctuation and the sharp decline in trading volume compared with March show that the market is in a boring stage.
Since the end of October last year, we have monitored the net outflow of US dollar stablecoins for the first time. The US ETF has also temporarily shown a significant shrinkage, both the net outflow and the net inflow have shrunk severely compared with March and April.
As we said before, once it reaches $60,000, it will reach the strong support area of 55,000-60,000, which is the mining cost price of miners, the average cost price of ETFs and the short-hand break-even point. Because of the weak breakthrough and the lack of good news on the macro side, this support area has reversed into a stampede area, which has led to an increasing probability of the market penetrating to $55,000.
For investors who lamented that BTC rose too fast in March and could not get on board, this is a very delicate test: if the current price is reduced by another 10%, the market will give a good entry window, so will you take this opportunity to enter?
Market sentiment tends to always chase ups and downs, and fear accumulates in long-term weak consolidation. If you can see that things in the next two years have high certainty, then this may be an opportunity worth considering. First, the interest rate cut has been postponed, but stagflation has also begun to appear, and the recession seems to have arrived, which is the strongest driving force for the interest rate cut; second, the US election is often a catalyst for market boost; third, the first three halving effects of BTC (a big bull market within 18 months after the halving) have not yet been reflected.
Supply and demand structure:
On average, the on-chain profit rate of BTC investors is about 1.1 times; this figure reached 1.7 times in March; the investment of short-term investors has decayed from a profit of 40% to 1%, and the loss is only a 5-minute K-line away.
We must emphasize that in the past two years, the loss of short-term investors is a sign of a stage bottom. The short-hand profit and loss indicator will only show a -10% phenomenon in an extreme bear market (at the end of 22 years).
The funds of US ETFs reversed the sharp outflow of the previous week last week, with a net inflow of 117 million US dollars, an increase from the net outflow of 434 million last week. But we expect to return to the track of weak net outflow this week.
Last week, stablecoins outflowed 460 million US dollars, the first significant outflow since the end of October last year. Of course, this is only the first net outflow since the stagnation of stablecoin net inflows on April 20, and whether it will continue remains to be seen. Compared with the cumulative net inflow of $15 billion in March and April, this is only a weak signal. As of April 28, the number of coins held by centralized exchanges was 2.333 million, a decrease of 3,000 from last week. Overall, the change in the stock of BTC in exchanges has been low in the past month. The purchase volume of exchanges has also increased slightly from $5 billion last week to $7.1 billion. Overall, the market is in a wait-and-see mood, the pace of new capital entering has slowed down significantly, and the market is in a fragile balance.
EMC BTC Cycle indicators:
Due to the decline in BTC new addresses, vitality indicators, exchange liquidity and other indicators, the EMC BTC Cycle engine shows that our bull market acceleration period has temporarily appeared in the gap, and the overall indicator has dropped from 0.75 to 0.37.
 Alex
Alex


