Author: QW, Aliance DAO Customer Support Source: X, @QwQiao Translation: Shan Ouba, Golden Finance
At Alliance Dao, we receive about 3,000 applications per year to join the cryptocurrency startup accelerator. The data we collect includes information such as the blockchain network they built, the type of product, the region they are located in, etc. Due to the large sample size and our relatively non-blind attitude towards these factors, we are able to draw unique insights into the direction of industry development.
Blockchain Network
Layer 1
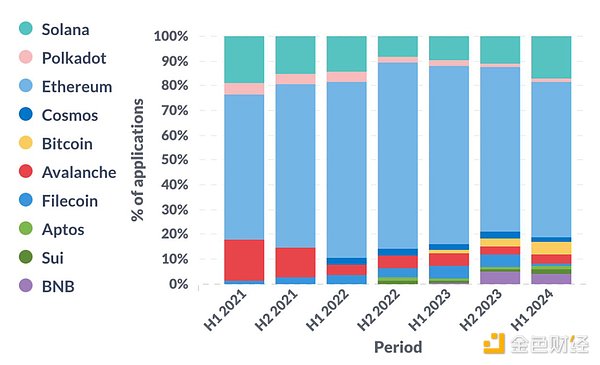
Ethereum is still the dominant ecosystem. However, after bottoming out in the second half of 2022, Solana is making a strong comeback. This is no coincidence, as FTX also collapsed in the second half of 2022. Bitcoin has experienced a resurgence with excitement surrounding ordinals, runes, and Bitcoin Layer 2.

Ethereum Layer 2
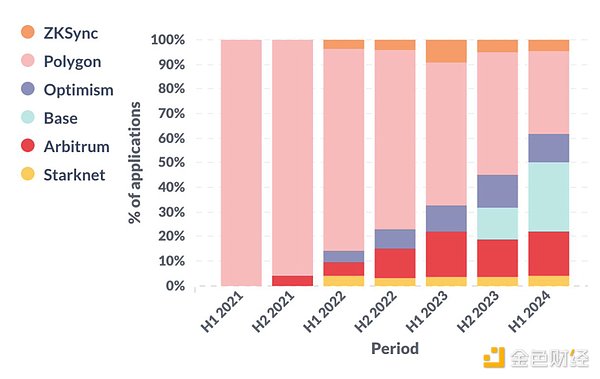
Deep study of Ethereum Layer er 2 (and side chains). Optimistic rollups have been steadily gaining market share over the past three years. It is worth noting that in the first half of 2024, more than a quarter of startups building on Ethereum Layer 2 chose the Base network.
Product Type
The number of startups combining blockchain technology for infrastructure, DeFi, payments, and AI is increasing, mainly at the expense of NFTs. Among them, infrastructure and AI are in line with the hot topics of public discussion. But the rise of DeFi and payments may surprise most people because the public is not very enthusiastic about them. Coincidentally, we believe these are also the only two verticals in the cryptocurrency space that have found undeniable product-market fit (PMF). Note that this is an imperfect attempt to organize product categories, as these categories are obviously not mutually exclusive. For example, a startup may be involved in both gaming and NFTs, in which case we would assign a weight of 0.5 to gaming and NFTs respectively.
Regional Distribution
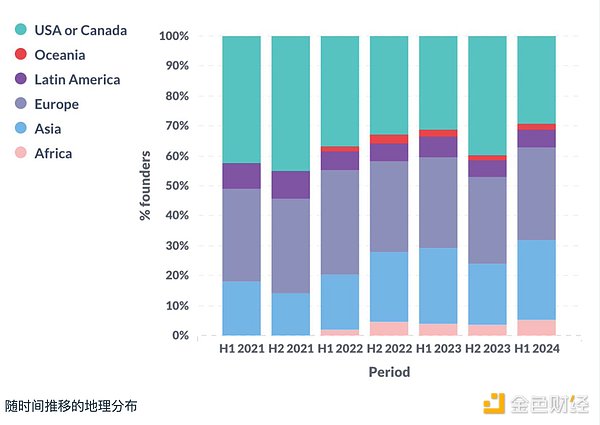
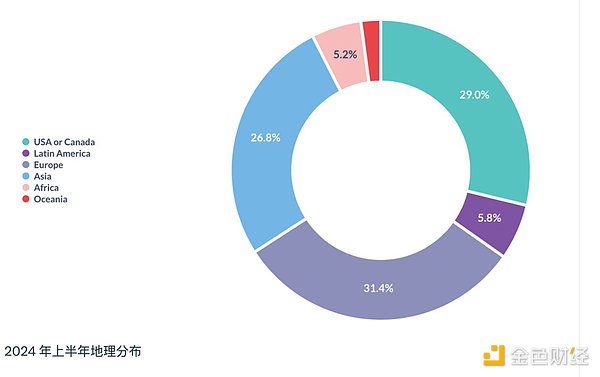
In the first half of 2024, the proportion of startups from the United States and Canada fell to an all-time low, while the proportion of startups from Asia and Africa reached an all-time high. This may be due to 1) regulatory uncertainty in the United States, and 2) the practical application of cryptocurrencies in emerging markets.
In summary, North America, Europe, and Asia remain the three major regions, with each region contributing a quarter to a third of the total number of startups.
The following section may be more attractive to founders and venture capital institutions and can be skipped by the general public.
Founder Background
Large Tech
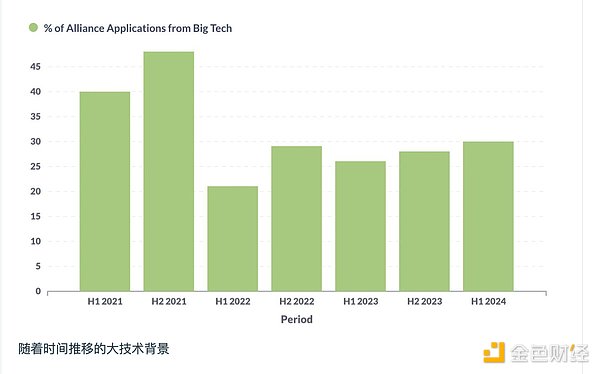
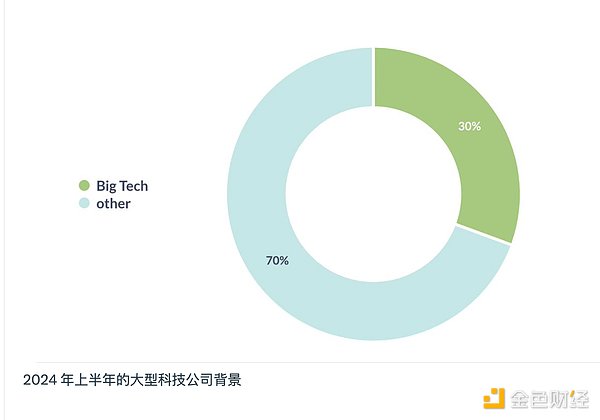
The percentage of founders coming from a “Large Tech” background peaked in 2021 and is now stable at around 30%. We define large tech as technology companies in the S&P 500. The exact definition is not important; what is important is to observe trends over time.
Top universities
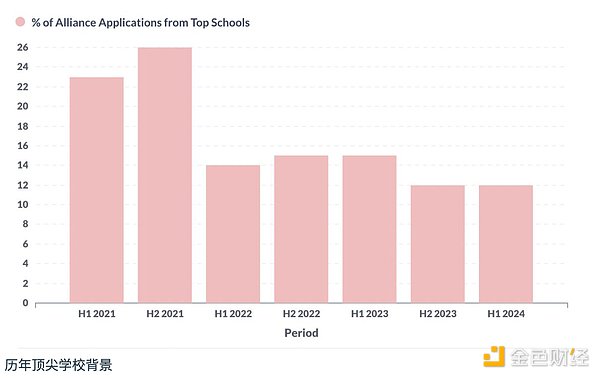
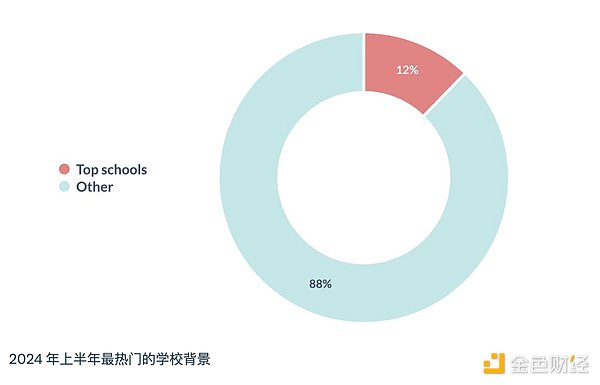
Similarly, the proportion of founders who graduated from “top universities” also peaked in 2021. We define top universities as those in the top 100 of the QS world rankings.
Serial entrepreneurs
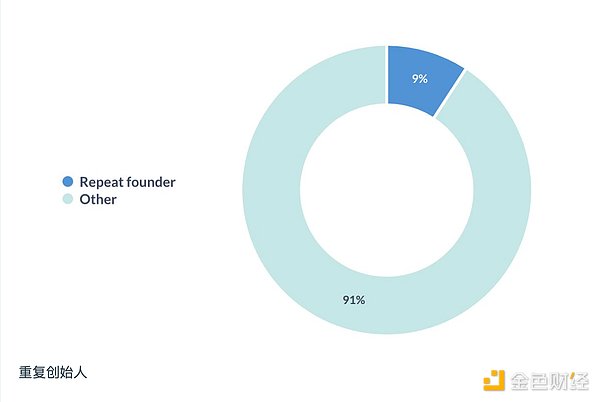
About one in ten founders have previously founded a startup.
Team composition
Team size
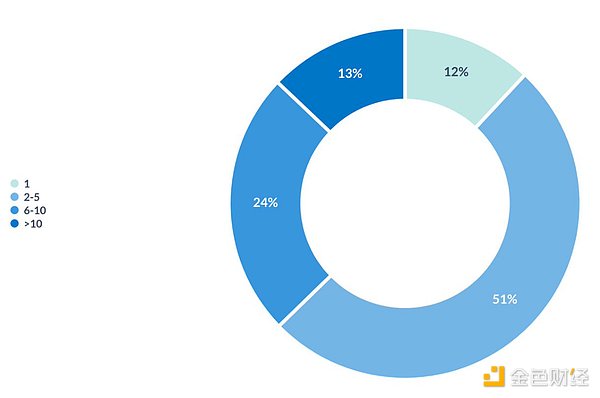
More than half of the startups have a team size of 2-5 people. We also believe that this is the optimal size for startups that have not yet found product-market fit (PMF).
Number of Co-founders
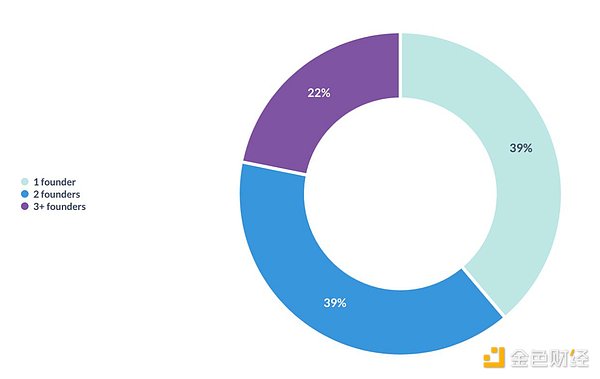
Less than 40% of startups are founded by a single founder. For reference, some studies show that 20-30% of unicorn companies were founded by a single founder.
Equity Distribution
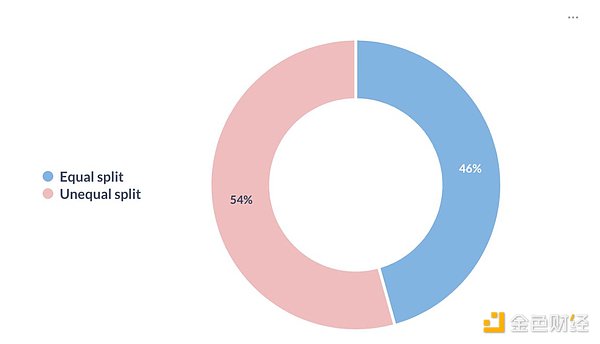
Among startups with two or more co-founders, about half will choose equal equity, and the other half will choose unequal equity.
Remote work
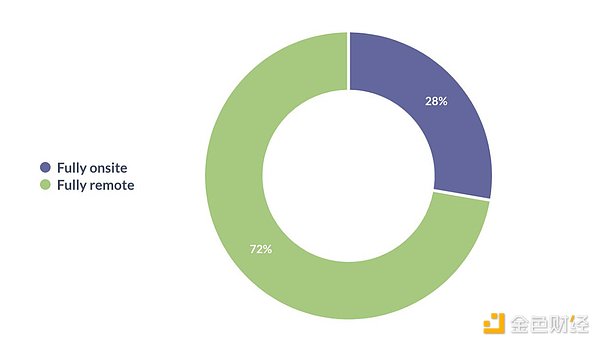
Nearly 3/4 of start-ups implement a full remote work system.
 Cheng Yuan


