Author: ASXN Source: X, @asxn_r Translation: Shan Ouba, Golden Finance
Ethereum ETF will be launched on July 23. There are many dynamics of ETH ETF that are ignored by the market, which are not present in BTC ETF. Let's take a look at flow forecasts, ETHE liquidations, and the relative liquidity of ETH:
The fee structure of the ETF is similar to that of the BTC ETF. Most providers will waive fees for a specified period to help accumulate AUM. As is the case with the BTC ETF, Grayscale maintains the ETHE fee at 2.5%, an order of magnitude higher than other providers. The main difference this time is the launch of the Grayscale Mini ETH ETF, which was previously not approved for a BTC ETF.
The Mini Trust is a new ETF product from Grayscale, with an initially disclosed fee of 0.25%, similar to other ETF providers. Grayscale’s idea is to charge lazy ETHE holders a 2.5% fee while directing more active and fee-sensitive ETHE holders to their new product, rather than having funds siphoned into low-fee products like Blackrock’s ETHA ETF. After other providers cut Grayscale’s fees by 25 bps, Grayscale made a comeback and reduced the Mini Trust fee to just 15 bps, making it the most competitive product. On top of this, they also moved 10% of ETHE AUM to the Mini Trust and gifted this new ETF to ETHE holders. This shift was done on a like-for-like basis, meaning it was not a taxable event.
The effect of this is that outflows from ETHE will be more modest than from GBTC, as holders will only have to transition to the mini-trust.
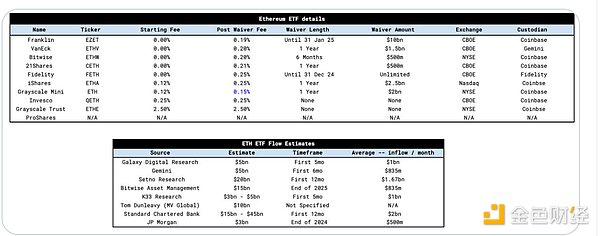
Now let’s look at the flows:
There are many estimates for ETF flows, and we’ve highlighted some of them below. Taking the estimates and normalizing them gives an average estimate in the $1 billion per month region. Standard Chartered gives the highest estimate at $2 billion per month, while JPMorgan’s estimate is lower at $500 million per month.
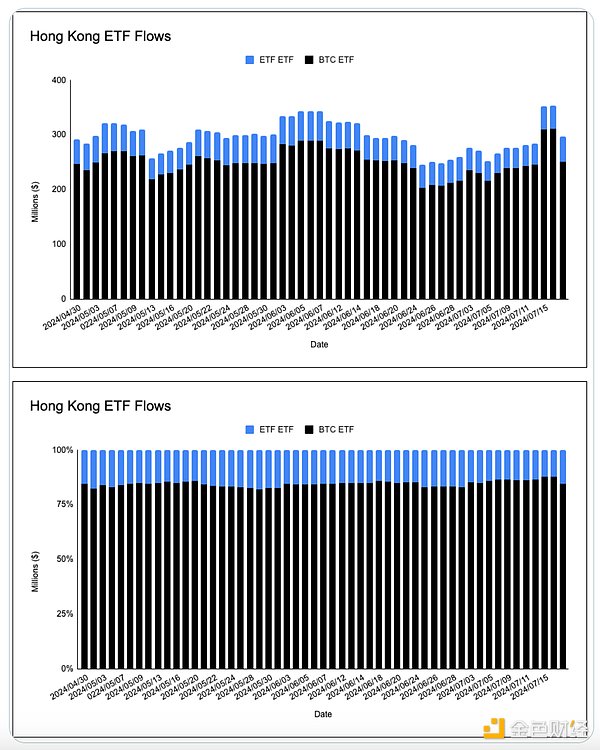
Fortunately, we have the help of the Hong Kong and European ETPs and the end of the ETHE haircut to help estimate flows. If we look at the AUM breakdown of Hong Kong ETPs, we come to two conclusions:
1. The relative AUM of BTC and ETH ETPs is overweight BTC and ETH, with a relative market cap of 75:25 and an AUM ratio of 85:15.
2. The ratio of BTC to ETH in these ETPs is fairly constant and consistent with the ratio of BTC market cap to ETH market cap.
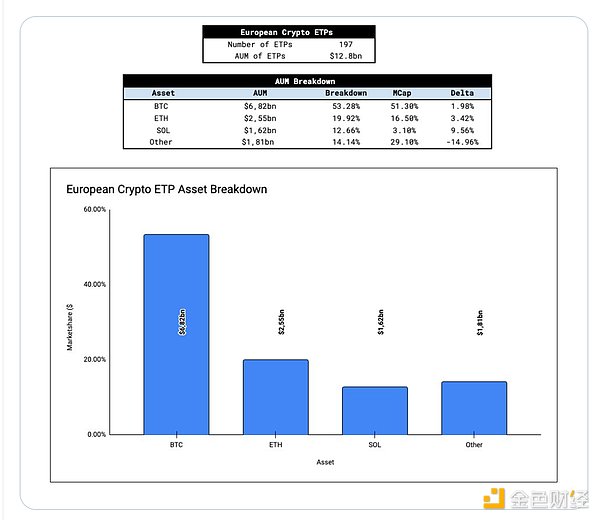
Looking at Europe, we have a much larger sample size to study - 197 cryptocurrency ETPs with a cumulative AUM of $12 billion. After we crunched the data, we found that the AUM breakdown of European ETPs is roughly in line with the market cap of Bitcoin and Ethereum. Solana is over-allocated relative to its market cap, at the expense of “other crypto ETPs” (anything but BTC, ETH, or SOL). Leaving Solana aside, a pattern begins to emerge - the breakdown of global AUM between BTC and ETH roughly mirrors the market cap weighted basket.
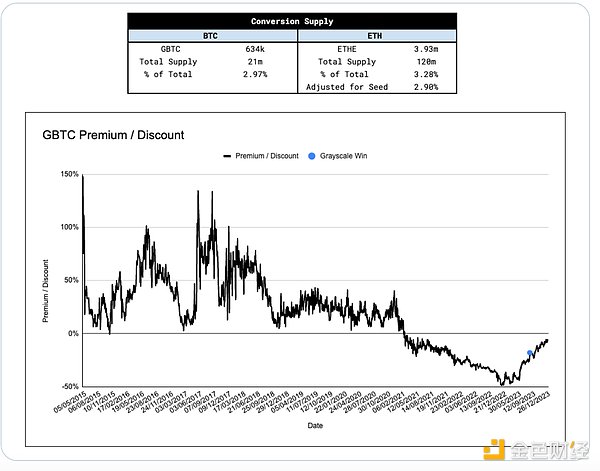
Given that GBTC outflows were the origin of the “sell the news” narrative, it’s important to consider the possibility of ETHE outflows. To simulate potential ETHE outflows and their impact on price, it is useful to look at the percentage of ETH supply in the ETHE instrument.
Once adjusted for Grayscale Mini Seed capital (10% of ETHE AUM), the existing ETH supply in the ETHE instrument as a function of total supply is similar to the proportion of GBTC at launch. It is unclear what proportion of rotations vs. exits are in GBTC outflows, but if we assume a similar proportion of rotations vs. exit flows, the impact of ETHE outflows on price is similar to GBTC outflows.
Another key piece of information that most people overlook is the premium/discount of ETHE to NAV. ETHE has been trading within 2% of par since May 24th, while GBTC first traded within 2% of NAV on January 22nd, just 11 days after GBTC converted to an ETF. The approval of the spot BTC ETF and its impact on GBTC is slowly being priced in by the market, and the discount ETHE is trading at relative to NAV has been more reflected in the GBTC story. By the time the ETH ETF goes live, ETHE holders will have 2 months to exit ETHE. This is a key variable that will help stem ETHE outflows, especially exit flows.
At ASXN, our internal estimate is $800M to $1.2B per month. This is calculated by taking the market cap weighted average of monthly Bitcoin inflows and scaling it by ETH's market cap.
Our estimates are supported by global crypto ETP data, which suggests that market-cap weighted baskets are the dominant strategy (we may see a rotation of BTC ETFs adopting similar strategies). Moreover, given the unique dynamics of ETHE trading at par prior to the launch and introduction of the mini-trust, we are open to upside surprises.
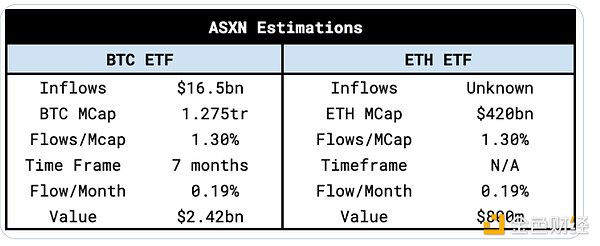
Our estimates of ETF inflows are proportional to their respective market caps, so the impact on price should be similar. However, it is also important to measure what proportion of the assets are liquid and ready to be sold - assuming that the smaller the "float", the greater the price response to inflows. There are two special factors that affect ETH’s liquidity supply, namely the native staking and the supply in smart contracts. As a result, ETH’s liquidity and sellable percentage are lower than BTC, which makes ETH more sensitive to ETF flows. However, it is worth noting that the incremental illiquidity between the two assets is not as large as some believe (ETH’s cumulative +-2% order depth is 80% of BTC’s).
Our estimates of liquid supply show the following:

When we look at ETFs, it is important to understand Ethereum’s reflexivity. The mechanism is similar to BTC, but Ethereum’s destruction mechanism and the DeFi ecosystem built on top of it make the feedback loop more efficient. The reflexive loop looks like this:
ETH flows into ETH ETF → ETH price increases → ETH interest increases → DeFi/chain usage increases → DeFi fundamentals improve → EIP-1559 destruction increases → ETH supply decreases → ETH price increases → more ETH flows into ETH ETF → ETH interest increases → …
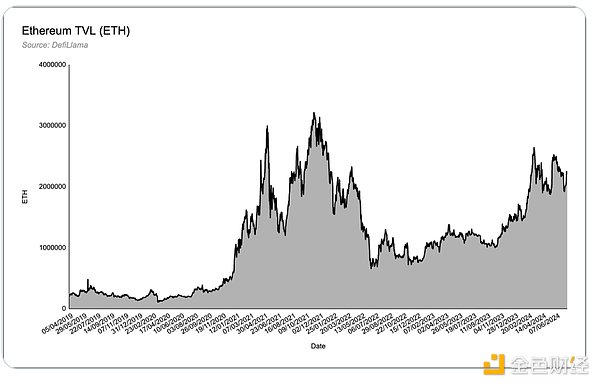
One thing that BTC ETF lacks is the lack of an ecosystem “wealth effect”. In the nascent Bitcoin ecosystem, despite the low interest in ordinals and inscriptions, we don’t see much of the proceeds being reinvested into projects or protocols at the base layer. Ethereum, as a “decentralized application store”, has a complete ecosystem that will benefit from the continued inflow of base assets. We believe that this wealth effect has not received enough attention, especially in the DeFi space. There is 20M ETH ($63B) of TVL in Ethereum DeFi protocols, and as ETH trades higher, TVL and revenues in USD terms surge, making ETH DeFi more attractive for investment. ETH has a reflexivity that does not exist in the Bitcoin ecosystem.
Other factors to consider:
1. What is the rotation flow from the BTC ETF to the ETH ETF? Assume that a non-zero portion of BTC ETF allocators are unwilling to increase their net crypto exposure but want to diversify. TradFi investors in particular prefer a market cap weighted strategy.
2. How well does TradFi understand ETH as an asset and Ethereum as a smart contract layer? Bitcoin’s “digital gold” narrative is both easy to understand and widely understood. How well can Ethereum’s narrative (settlement layer for the digital economy, three-point asset theory, tokenization, etc.) be understood?
3. How will the above market conditions affect ETH’s flow and price action?
4. The ivory tower lawsuit designates two crypto assets to connect their worlds – Bitcoin and Ethereum. These assets have crossed the proverbial zeitgeist. Given that TradFi capital allocators are now able to offer products that can charge fees, how does the introduction of spot ETFs change their view of ETH? TradFi’s thirst for yield makes Ethereum’s native yield through staking a very attractive proposition for providers, and we believe that staking an ETH ETF is a when, not an if. Providers can offer 0-fee products and earn an order of magnitude more than normal ETH ETF fees simply by staking ETH on the backend.
 JinseFinance
 JinseFinance
 JinseFinance
 JinseFinance
 JinseFinance
 JinseFinance
 Bitcoinist
 Bitcoinist
 Bitcoinist
 Bitcoinist
 Bitcoinist