Author: Michael Nadeau, The Defi Report; Compiler: Deng Tong, Golden Finance
Our thesis is that there will eventually be a handful of layer 1 blockchains that achieve mass adoption.
Our view is:
Bitcoin has achieved a monopoly as "internet money" or "digital gold" as a global store of value.
Ethereum's network effects point to L1 becoming a global monopoly of the "open source app store."
Solana has firmly established itself as the second largest smart contract network.
We believe these three assets should form the basis of a well-constructed crypto portfolio. Of course, these are large-cap stocks. The biggest gains in this cycle are unlikely to come from these three assets.
Instead, small-cap stocks with high beta coefficients compared to these assets are more likely to outperform. These are high risk/reward investments that can serve as a "hot sauce" for a portfolio with less allocation.
But how hard is it to identify the winning asset?
This week, we’re taking the mystery out of the way and showing you just how difficult it is to outperform the top L1 native assets.
What is Beta?
In finance, beta is a measure of a stock’s volatility relative to the overall market or a benchmark asset. In this case, we’re using the leading L1 assets as our benchmark: ETH and SOL.
A beta of 1 = the measured asset moves in line with the benchmark asset.
A beta of > 1 means the measured asset is more volatile than the benchmark asset. For example, an asset with a beta of 1.5 means that if the benchmark asset moves 5%, the measured asset will move 7.5%. So if the benchmark asset falls by 5%, an asset with a beta of 1.5 is expected to fall by 7.5%.
A beta of < 1 means the asset being measured is less volatile than the benchmark asset. For example, an asset with a beta of 0.5 is expected to move 50%, or half the amount of the benchmark asset.
A negative beta means the asset being measured moves in the opposite direction of the benchmark asset. For example, if the benchmark rises by 1%, an asset with a beta of -0.1 is expected to fall by 0.1%.
We use betas to help us understand the risk/return of various assets and as a portfolio management tool - especially during bull markets, high beta assets tend to perform best.
Which assets have high betas relative to ETH?
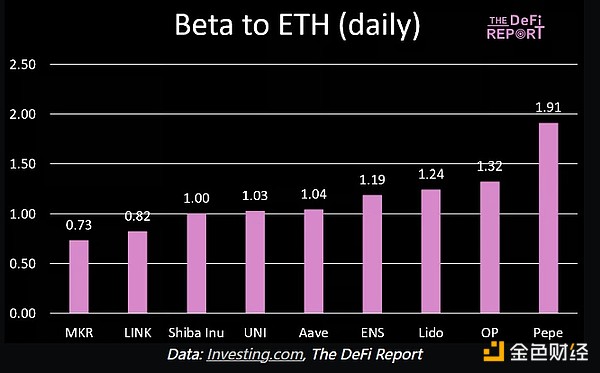
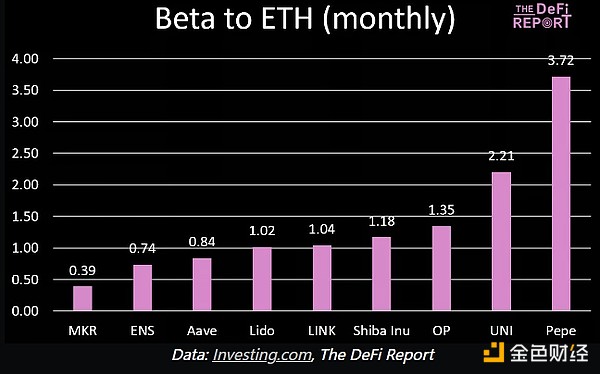
Please note that the data compiled in this week's report is analyzed against daily, weekly, and monthly betas for completeness. That being said, our focus is on monthly data as it cuts out some of the noise from shorter timeframes - and tends to be more suitable for investors with longer time horizons.
The assets selected are based on projects with strong fundamentals, and large-cap memecoins are included in the analysis.
Finally, the data is based on a 1-year lookback as we only want to see how these assets perform under the current bull market conditions (as a forecast for what may happen later in the cycle).
Without further ado, let's get into the data.

Key Takeaways
Pepe has the highest beta to ETH of all assets across all periods.It appears to be trading similarly to how Shiba Inu did in the last cycle.
MakerDAO has the lowest beta to ETH across all periods.Its monthly beta of 0.39 suggests that if ETH doubles, MKR would only appreciate by 39%.
In general, the strongest projects with 1) fundamentals, 2) product-market fit, 3) Lindy Effect, 4) strong brands usually have lower betas to ETH - indicating less risk (and potentially less upside).
1 Year Returns vs ETH
Key Takeaways:
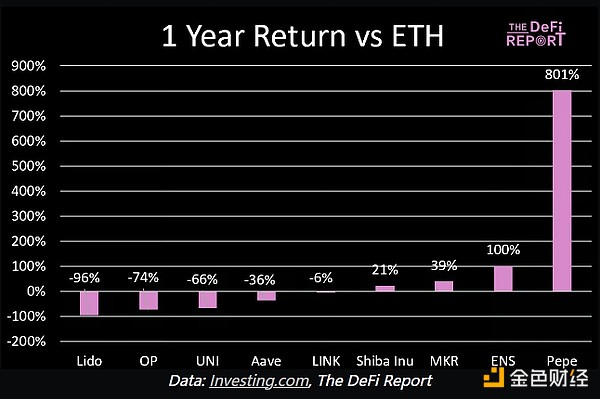
Over the past year, only 4 of the 9 assets selected have outperformed ETH - this goes to show how difficult it is to beat the bellwether asset in crypto (most VCs struggle to beat their benchmarks).
MakerDAO stands out here as it has the lowest beta (indicating lower risk) but has outperformed ETH by 39% over the past year.
ENS has the second lowest monthly beta (.74) but has the second-best performance against ETH over the past year. Again, this indicates lower risk but has still outperformed.
DeFi OGs including Chainlink continue to struggle against ETH.
Pepe is the standout asset in the Ethereum ecosystem this cycle.
Which assets have a high beta to SOL?
Once again, we have chosen assets with strong fundamentals and product-market fit for multiple use cases.
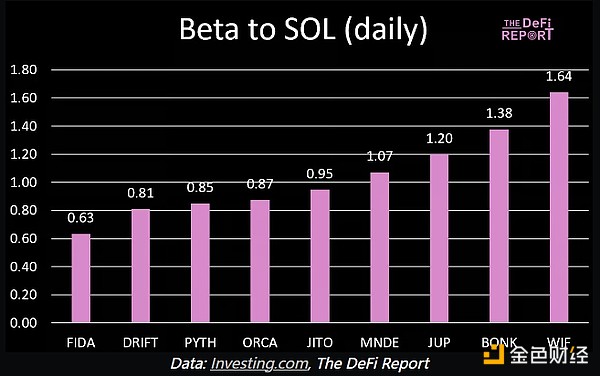

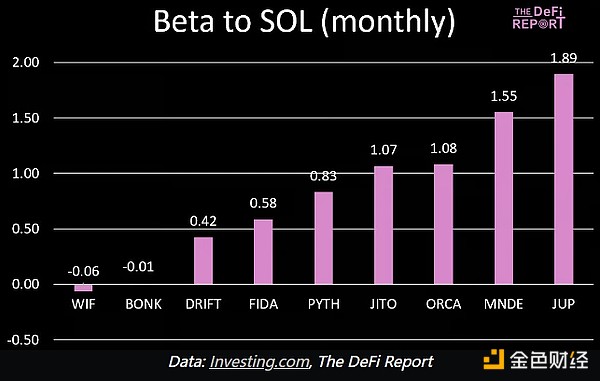
*Note that WIF, JUP, JITO, PYTH, and DRIFT tokens have been publicly traded for less than a year. Performance compared to SOL is measured based on the length of time the asset has been in the market.
Key Takeaways:
Bonk and WIF have the highest betas to SOL based on daily market movements. However, both assets have negative betas based on weekly and monthly market movements. This suggests that over longer time frames, both assets move inversely to SOL.
From a monthly market movement perspective, Jupiter and Marinade are the only assets in the group with positive beta coefficients. This shows that SOL itself is very volatile - as smaller market caps in the ecosystem are less volatile on a monthly timeframe.
1 Year Return vs. SOL Return
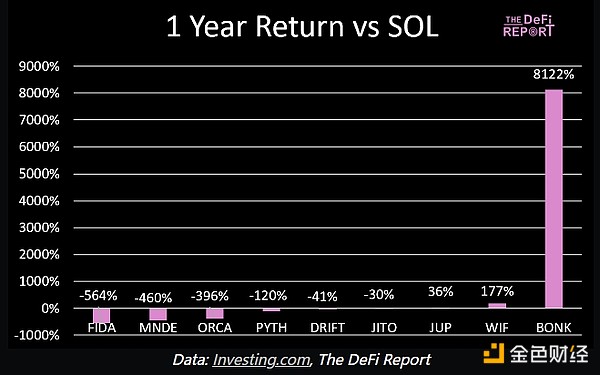
Key Takeaways:
It’s really hard to outperform SOL in this cycle. The token is up 638% in the past.
Bonk is the only asset that outperformed while publicly trading throughout the year (WIF started trading in Q4, JUP started trading in Q1). It did so in a big way — up 87x (!).
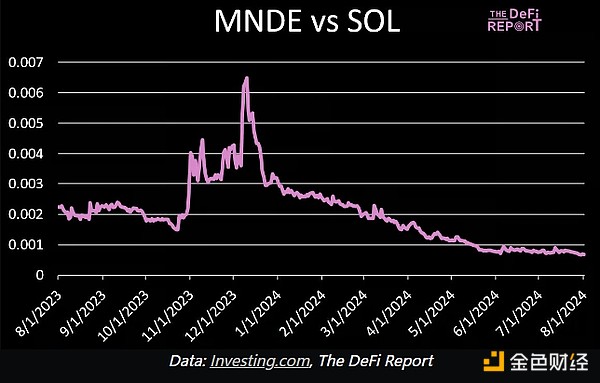
It’s worth noting that some projects have significantly outperformed SOL over short periods of time. For example, Marinade and Orca both appreciated 10x in a 6-week period in Q4 last year — highlighting the need for active management of smaller assets.
Conclusion
There’s a reason most VCs have trouble outperforming the bellwether assets in crypto. It’s really hard. If you don’t have 24/7 access to the market, the upside of a quant strategy, or access to the best seed-stage deal flow, you’re better off strictly allocating to the leading assets.
Congratulations to those who invested in Bonk early last year and stuck with it. You’ve probably outperformed the vast majority of the highest paid fund managers in the world. We’ll note that on crypto Twitter, there seems to be more consensus that WIF is the preferred Solana meme token of this cycle – sentiment-wise. However, Bonk has far outperformed expectations. We think it has a good chance of continuing this momentum later in this cycle.
Wonder what SOL’s beta to the S&P 500 has been over the past year (using monthly data)? 8.37 (!). That’s why it has been the trade of this cycle so far.
Keep in mind that there are a lot of nuances to sift through in how we present the data in this report (primarily having to do with the time periods measured). As mentioned earlier, some assets outperformed over a short period of time, but ended the year well below their benchmark – highlighting the need for active management.
This report highlights how difficult it is for altcoins to outperform the top L1s. That being said, historically altcoins have rallied in the late stages of bull cycles - we expect this to happen later in the cycle. Keep in mind that it may be new projects that end up outperforming - such as Celestia, Monad, or Berachain (the latter two have yet to launch).
We believe it is prudent to have some exposure to some large-cap quality meme coins (we own Bonk).
 Xu Lin


