Author: William Suberg, CoinTelegraph; Compiled by: Songxue, Golden Finance
A long-term market participant said that the price of Bitcoin is about to rise.
In a Dec. 27 post on X (formerly Twitter), trader and popular social media commentator Matthew Hyland predicted the “coming” Bullish trend.
Bitcoin trader: “Looks like a rally is about to happen”
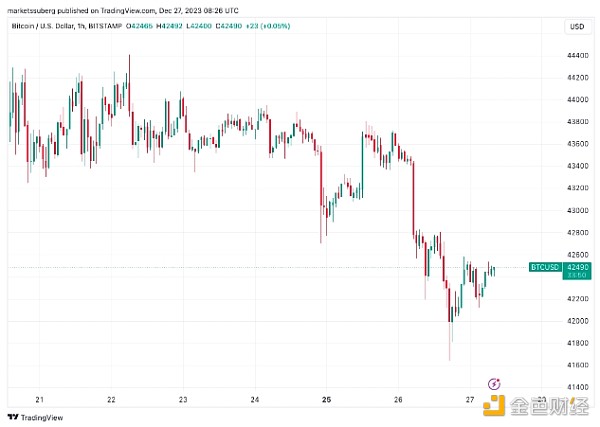
According to Cointelegraph Markets Pro and TradingView According to data, Bitcoin may have been in the doldrums over the Christmas period, falling to a low of $41,650, but that trend may soon change.
For Hyland, two key BTC price indicators point to the direction of a short-term reversal.
These come in the form of Bollinger Bands and the Relative Strength Index (RSI), which foreshadow the upward trend in recent months.
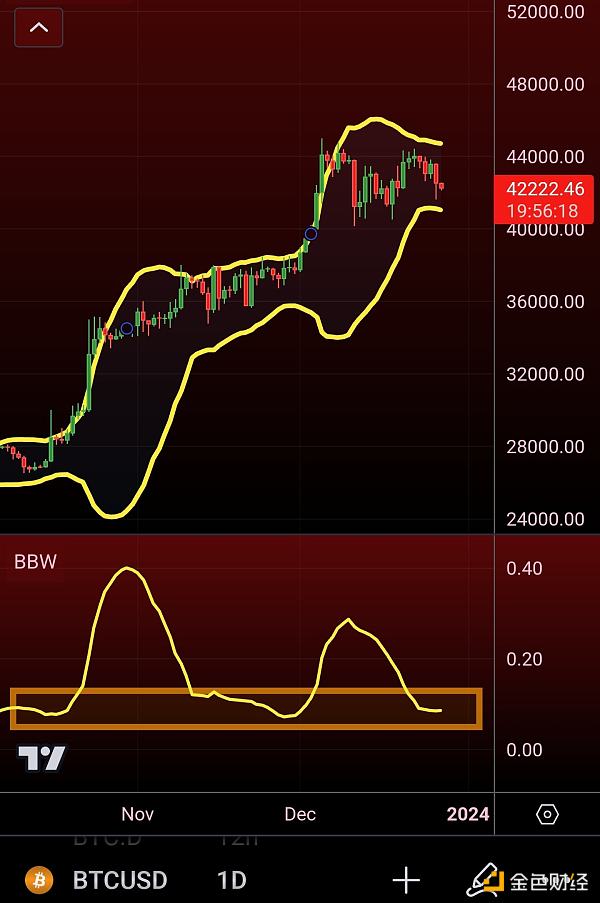
"The daily Bollinger Bands have squeezed again to trigger the last two increases to the $30,000 and $40,000 levels. With the daily relative strength indicator (RSI) falling to two months of lowest levels, and the 3-day exponential moving average convergence divergence (MACD) is currently crossing lower in less than 3 days," he wrote.
“Looks like a rally is coming.”

BTC/USD 1 hour chart. Source: TradingView
Bollinger Bands Contraction
Bollinger Bands are a popular volatility indicator that closely track BTC price action and indicate when volatility may explode. .
Currently, the daily time frame is narrowing after a period of expansion - although not necessarily directly narrowing, but this is the situation before a new round of volatility.
Earlier this year, the range reportedly fell to extremely tight levels before rallying above $30,000.

BTC/USD chart with Bollinger Bands data. Source: Matthew Hyland/ The Relative Strength Index (RSI) has proven to be a faithful tool for Bitcoin traders during the bull run resurgence in the fourth quarter.
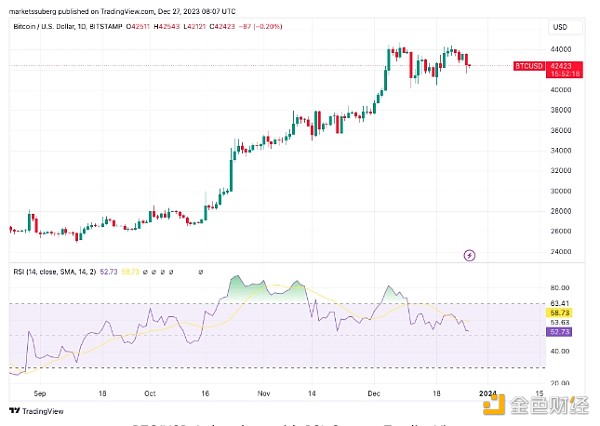
The classic momentum oscillator, which provides insight into how overbought or oversold BTC/USD is at a given price, saw some resets on the daily time frame in late December.

BTC/USD 1-day chart and RSI. Source: TradingView
Currently, the RSI is at 53, firmly below the “overbought” line of 70, and even further below the peak of 76 so far this month.
As veteran trader Peter Brandt pointed out last week, longer time frames are equally promising.
"Daily RSI is currently at its lowest level in over two months; when price is below $27,000," Hyland added in a separate X post at the same time.
MACD Countdown to Bears
However, when it comes to Bitcoin bulls, another indicator may Hindering the development of the Bitcoin bull market.

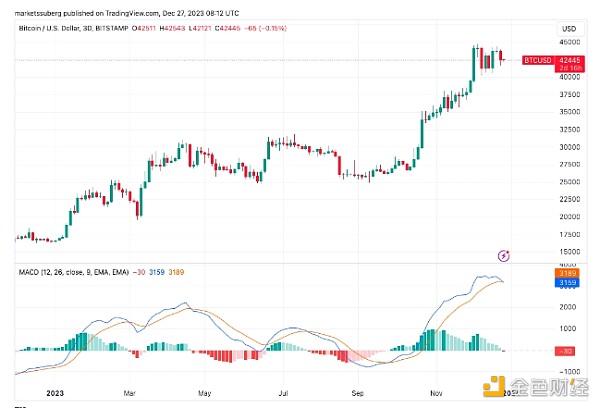
BTC/USD 3-day chart and MACD. Source: TradingView
This is the Moving Average Convergence Divergence (MACD), and it is threatening a bearish trend reversal on the three-day time frame.
Hyland noted that it will take a few more days for the signal to "negate itself" due to price action.
A further comment on December 27th read: "Cross was 100% accurate all year, causing prices to drop and rise.
 JinseFinance


