Source: The Defi Report; Compiled by Wuzhu, Golden Finance
2025 is going to be an important year. I’m very excited to share our data-driven analysis and market insights with you.
As we head into 2025, we’ll share our thoughts on the “Altcoin Season” and our current thoughts on macro issues for the year ahead.
Has the Altcoin Season Already Arrived?
Given Solana’s stellar performance in 2024, the meme coin craze, the resurgence of DeFi, and the recent rise of artificial intelligence agents, some believe that the “Altcoin Season” has arrived.
We disagree.Why?
We think SOL’s outperformance is largely a severely underestimated rally in 2023;
The meme mania looks more like the DeFi summer of 2020 (a glimpse of the coming bull run in 2021);
The DeFi resurgence (Aave, Hyperliquid, Aerodrome, Pendle, Ethena, Raydium, Jupiter, Jito, etc.) is real, but DeFi still feels niche. According to Kaito AI, its narrative share as a sector declined in 2024;
The rise of AI agents looks more like a glimpse of “alt season” than the actual thing.
We can admit that there is a lot of froth in the market. But the overall data doesn’t lie.

Source: CoinGecko
Quick Analysis:
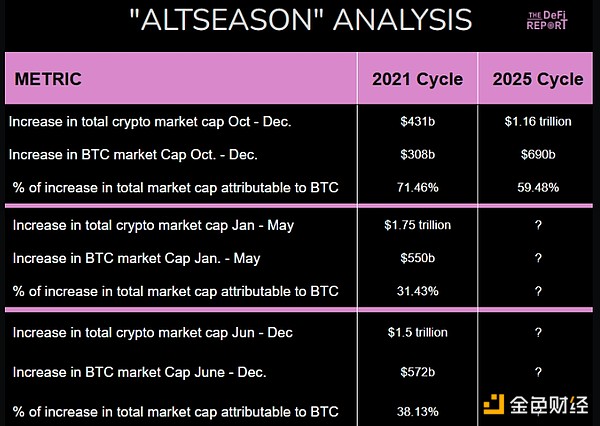
In the last cycle, the total cryptocurrency market value increased by $431 billion in the fourth quarter of 2020. Bitcoin accounted for 71.5% of the increase. BTC's dominance reached 72% (cycle peak) on January 3, 2021.
In the current cycle, total crypto market cap grew by $1.16 trillion in Q4. BTC accounted for 59.5% of that gain. BTC dominance is now at 56.4% — just below the cycle peak of 60% set on November 21, 2024.
Now. You might think that BTC’s smaller share of total crypto market cap growth in this cycle means altcoin season is here.
But look what happened as we head into 2021, the final year of the previous cycle:
Between January 1, 2021 and May 11, 2021, crypto market cap grew by $1.75 trillion. BTC accounted for only 31% of the gain. Dominance fell to 44%.
Total market capitalization fell by nearly 50% between May 11, 2021 and June 30, 2021. BTC fell by about 50% during the same period.
The market then rebounded, peaking at $3 trillion in market capitalization on November 8, 2021. BTC accounted for only 38% of the second gain.
Key Points to Watch:
While some believe this is "Bitcoin's cycle" (due to ETH underperformance, ETF dominance, Strategic Bitcoin Reserve hype, L2, etc.), the data shows that BTC is actually stronger as we transition into '21 - the last year of the previous cycle.
In the last cycle, the "Alt Season" kicked off with a bang as the new year arrived. From January to May, ETH rose 5.3 times. Avalanche rose 12 times. SOL rose 28 times in the same period. DOGE rose 162 times. This is the true face of the "Alt Season". During this period, Bitcoin's dominance fell by nearly 30%.
As mentioned earlier, we are seeing some froth in the market today. That being said, We believe that the "Alt Season" has just begun - Bitcoin's dominance has fallen from the cycle peak of 60% on November 21, 2024.
We forecast the total cryptocurrency market cap to grow to $7.25 trillion next year (up 113% from today). If 35% of funds flow to BTC from now on, the total market cap will reach $3.2 trillion, or $162,000 per BTC. Our optimistic case forecasts a total cryptocurrency market cap of $10 trillion. If 35% of funds flow to BTC, the total market cap will reach $4.2 trillion, or $212,000 BTC. Our pessimistic case forecasts a total market cap of $5.5 trillion. If 35% of funds flow to BTC, the total market cap will reach $2.6 trillion, or $131,000 BTC.
We expect $2.5 trillion to flow into non-BTC assets this year — double the previous cycle in 21 years. To put it in perspective: Solana, Avalanche, and Terra Luna had a combined market cap of $677 million on January 1, 2021. They peaked at $146 billion at the end of the year. That’s a 21,466% gain. Again. We haven’t seen a massive move like this before. That doesn’t mean it’s bound to happen.
AltSeason occurs for a variety of reasons. But we believe there are 4 main drivers:
1) BTC Wealth Effect: BTC investors take profits + seek bigger returns on the risk curve.
2) Media attention. More attention = more users into crypto. Many will invest in what they believe to be the “next Bitcoin”.
3) Innovation. We typically see new and exciting use cases emerge late in a cryptocurrency cycle.
4) Macro/Liquidity Conditions/Fed Policy – Driving Sentiment and Animal Spirits.
Speaking of Macro Conditions…
If we want to have a proper “altcoin season”, we believe macro and liquidity conditions must align with the growing risk appetite of market participants.
Macro Framework for 2025
In this section, we will analyze some of the key economic drivers of risk assets like cryptocurrencies while considering the probabilities of various outcomes for 2025.

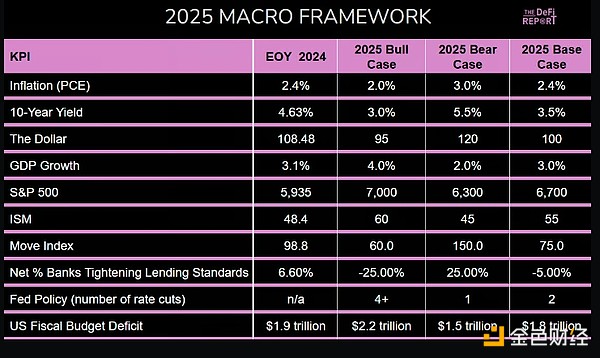
Inflation (PCE)
As we noted in our last report, the Fed is worried about inflation. Hence, they changed their rate cut forecast for this year from 4 to 2 at the November FOMC meeting. The market sold off as a result.
Our view on inflation:
We think the Fed/markets are lopsided on inflation. Why? The main drivers of inflation during COVID-19 are 1) supply chain issues, and 2) wartime money printing (fiscal) + zero interest rate policy (Fed).
So, to predict a pickup in inflation, we need a catalyst. Some may point to oil. But we think Trump’s “drill baby drill” policies are deflationary for oil prices (increasing supply should cause prices to fall). Others point to fiscal spending and the projected $1.8 trillion deficit for 2025. Tax cuts, deregulation, tariffs, all fair game.
But we also have deflationary forces in our economy. Like AI and other technological innovations. Our population is aging – many baby boomers are retiring. Our population is also shrinking due to persistently low birth rates. And now we have tight border policies.
These are all deflationary. Yet some still think inflation will “come back” to 70s levels. They make these comparisons without taking into account how different today’s economy, demographics, commodity markets, etc. are.
So our base case is for inflation to remain roughly within the range of what we see today (2.4% PCE). It could even fall. We think this is bullish for risk assets because it could lead to more than 2 rate cuts next year – which is not currently factored in.
10-Year Yield
The yield ended the year at 4.6% – a full 1% higher than on September 16th when the Fed started cutting rates. So the Fed is trying to ease monetary policy. But the bond market is tightening monetary policy. Why? We think there are three main drivers:
Inflation.The bond market believes that the Fed’s rate cuts could lead to a return of inflation.
Fiscal spending concerns and debt growth.Large deficits lead to increased Treasury issuance – which could lead to an oversupplied market. To attract buyers, rates must rise (unless the Fed steps in as a buyer – which we expect later this year).
Growth expectations.Accelerating economic growth in 2025 due to Trump’s policies (tax cuts, deregulation) could lead to higher inflation.
The Fed is trying to ease monetary policy.
Our view on rates:
We think it is fair for the bond market to reprice the 10-year yield given the concerns mentioned above. We note that the Treasury needs to refinance more than 1/3 of all outstanding debt this year, much of which is at the short end of the curve - where there are more buyers - and Secretary Yellen front-loaded most of the refinancing in the last cycle. If new Treasury Secretary Scott Bessent tries to pay down debt, it could create a supply-demand imbalance at the long end of the curve and cause yields to spike.
We think these risks are reasonable. But we also think the Fed has the tools (QE) to control yield increases if needed. We think the Trump administration will do whatever it takes to increase asset prices.
We see the 10-year yield at 3.5-4%. It could go lower. Again, we think this is positive for risk assets.
Growth and the S&P 500
While fourth quarter data is not yet available, growth through the first three quarters suggests we are on track for 3.1% economic growth in 2024. The latest GDP Now forecast from the Atlanta Federal Reserve Bank suggests growth of 2.6% next year.
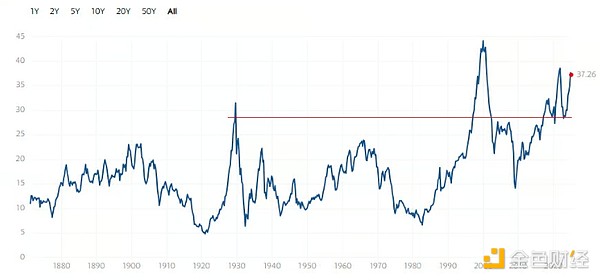
Meanwhile, the S&P 500 is up 25% last year. It is up 24% in 23 years. The CAPE ratio (which measures valuations relative to inflation-adjusted earnings over the past 10 years) is currently at 37.04, which is significantly above the historical average of 17.19, suggesting a possible regression in 25 years.
But we shouldn’t blindly assume that mean reversion is imminent. What if lower taxes and deregulation increase revenues? What if automation increases efficiency? Or does the anticipation of these things drive market participants to buy stocks?
It’s worth noting that the CAPE ratio bottomed in October 2022, close to the peak valuation level seen in 1929, just before the Great Depression. We believe that the nature of the modern global liquidity cycle may be distorting asset valuations – especially after the 2008 financial crisis. After all, governments around the world continue to mask the problems of aging populations by printing money – creating asset bubbles and giving rise to an increasing number of zombie companies in the process.

Data: DeFi Report, S&P 500 CAPE Ratio (from multpl.com)
Our view on growth and S&P 500:
We think the data could surprise to the upside this year. But a lot depends on whether Trump can push Congress through tax cuts and deregulation.
That being said, we don’t think a recession is imminent. Despite the high CAPE ratio, we don’t think we are in a bubble either. Our base case is for the S&P 500 to grow 12.8% this year.
Short-Term View:
The labor market is cooling, with unemployment at 4.3% (up from 3.6% last year). The ISM index is at 48.4, suggesting a modest contraction in the manufacturing sector (11% of GDP). Meanwhile, the Fed has cut rates 3 times, a 1% cut cycle. Markets are currently pricing in a pause in January, with a 88% cut. There is no FOMC meeting in February.
Thus, the Fed Funds rate looks set to remain at 4.25-4.5% until March at the earliest. Additionally, the debt ceiling fight looms, as Secretary Yellen has indicated that the Treasury will hit its borrowing limit between January 14 and January 23. As a result, we believe the Treasury may have to tap the TGA - the Treasury's operating account at the Fed that can be tapped in emergencies. There is currently about $700 billion in the account. The Fed can also use the reverse repo facility to release liquidity in an emergency.

Therefore, we believe there may be some volatility in the first quarter, which will eventually lead to liquidity injections from the Fed/Treasury, etc. We expect some volatility in the short term.
Conclusion
We believe that "altcoin season" has just begun. But we also believe that macro and global liquidity conditions need to support a proper rotation of altcoins this year.
Of course, macro is difficult to predict. But we hope that our analysis helps you develop your own framework for how this year may develop.
We see no rate hike risk - the last rate hike cycle ended in November 2021;
We see no recession risk ahead (although some sectors such as commercial real estate are still experiencing pain);
We think the Fed/markets are offside on inflation;
We think the labor market could show further signs of weakness in Q1;
We think yields will fall later this year and the Fed could buy Treasuries (quantitative easing) while keeping rates low;
We still see upside risks this year as we believe the market landscape is similar to the 90s as Trump came to power during a period of rapid technological advancement.
We expect some volatility/drama as the debt ceiling debate unfolds in the coming weeks;
The biggest risk is a black swan event that would force the Fed to cut rates quickly as markets could sell in a panic and then ultimately be boosted by liquidity.
 Catherine
 Catherine
 Miyuki
 Miyuki
 Weiliang
 Alex
Alex Miyuki
 Alex
Alex Miyuki
 Weiliang
 Alex
Alex