Source: Grayscale; Compiled by Wuzhu, Golden Finance
Smart contract platforms are the core infrastructure for decentralized applications and blockchain finance. As such, they are critical to the public chain’s vision of providing a new architecture for financial markets and digital commerce.
Grayscale Research believes that smart contract-based applications will accelerate in popularity over the next 1-2 years, in part due to regulatory changes and upcoming legislation in the United States.
Ethereum is the largest smart contract platform, as measured by: (i) market capitalization; (ii) the size of the application ecosystem and developer community; and (iii) the value of on-chain assets. However, Ethereum has recently lagged behind competitors such as Solana in terms of fees and other on-chain activity metrics.
We believe that Ethereum’s differentiated features, including its culture of decentralization, security, and neutrality, will help it continue to capture a large share of users, developers, and transaction fees in the smart contract platform cryptocurrency space, even as some newer blockchains begin to gain popularity and gain market share. As such, Ethereum should be considered an integral component of a diversified cryptocurrency portfolio.
The outlook for smart contract platform fees is highly uncertain, in part because we do not know how much pricing power a platform like Ethereum will be able to maintain over the long term. However, Grayscale Research shows in this report how Ethereum has maintained pricing power by executing its scaling strategy, increasing total fees from an annualized $1.7 billion over the past six months to over $20 billion.
Along with Linux, Python, and a number of other open source software projects, Ethereum is arguably one of the most important open source software projects ever created. Despite being less than 10 years old, the Ethereum network now has over 11,000 nodes, processes 35-40 million transactions per month, secures approximately $46 billion in transaction value, and benefits from the support of over 2,100 full-time developers. The broader Ethereum ecosystem of interconnected blockchains currently processes approximately 400 million transactions per month. [1]
Despite Ethereum’s prominence in the cryptocurrency industry and the launch of a spot exchange-traded product (ETP) last year, the market capitalization of its network token, Ethereum (ETH), lags far behind that of Bitcoin (BTC). In fact, the ETH/BTC price ratio has fallen back to levels not seen since mid-2020 (Figure 1). In terms of market capitalization, Ethereum’s market cap has increased by approximately $90 million since the end of 2022, while Bitcoin’s market cap has increased by approximately $1.35 trillion (or approximately 15 times). [2] Ethereum has also recently underperformed the tokens of certain other smart contract platforms, including Solana and Sui.
Figure 1: Ethereum has lagged behind Bitcoin for more than two years
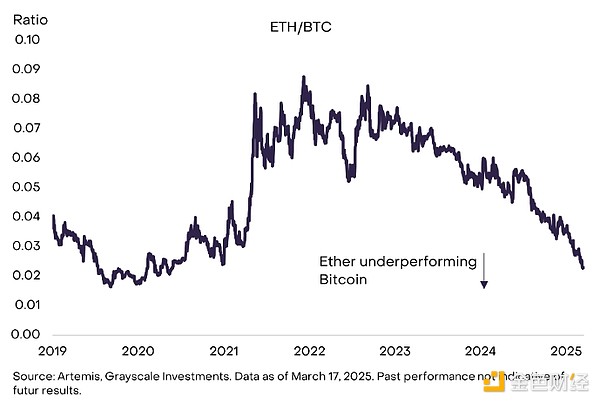
The continued poor performance has led some observers to question the outlook for Ethereum network activity and the value of Ethereum. Although there is uncertainty about the outlook for every crypto asset, we still believe that Ethereum should be considered an integral component of a diversified crypto portfolio.
Ethereum is not directly comparable to Bitcoin. The Bitcoin network is a monetary system, while the Bitcoin asset is primarily used as a medium of exchange and a store of value. As such, it belongs to the Grayscale Currency Crypto Sector. Bitcoin’s relatively strong price returns reflect investor demand for its scarce and censorship-resistant digital currency properties.
Ethereum, by contrast, is an application platform that provides utility to users of those applications. Ethereum, along with Solana, Stacks, Sui, and many other networks, is part of the Grayscale Smart Contract Platform crypto sector. Despite the promise of smart contract technology, we have yet to see mass adoption of decentralized applications based on smart contracts. While there have been many early success stories — including the growth of stablecoin trading — adoption is currently very low compared to the smart contract platform’s vision of bringing much of traditional financial business onto the blockchain.
Grayscale Research believes that the adoption of smart contract-based applications will accelerate in the next 1-2 years, in part due to regulatory changes and upcoming legislation in the United States. The Trump administration has made changes to federal cryptocurrency policy that will be conducive to the industry investing and thriving in the United States. [3] In addition, a bipartisan group of senators introduced the Guiding and Establishing a United States Stablecoin National Innovation Act (GENIUS). Building on the efforts of the previous Congress, the bill seeks to provide a comprehensive regulatory framework for the issuance of stablecoins for payment purposes. Greater regulatory clarity will help increase investment in and adoption of blockchain-based applications, thereby increasing on-chain activity (e.g., transactions and fees) and ultimately the value of smart contract platform tokens.
After initially taking the lead, Ethereum now faces stiff competition from other smart contract platforms and will need to execute an ambitious development plan to succeed. However, Ethereum also has some differentiating features that we expect to be particularly important for financial use cases—including a large on-chain funding pool and design choices that emphasize decentralization and neutrality. As a result, we expect Ethereum to account for a significant share of on-chain activity in the future, which in turn will drive the value of Ether.
Everything is a “Computer”
Ethereum is the first major smart contract platform blockchain. Like Bitcoin, the Ethereum blockchain can be used to send and receive transactions. However, with the addition of smart contracts, Ethereum can also run decentralized applications. These applications can be anything from decentralized lending platforms to identity solutions to video games. [4] Because Ethereum serves as infrastructure for applications, it can be thought of as a software-based computer, sometimes referred to as the “world computer.”
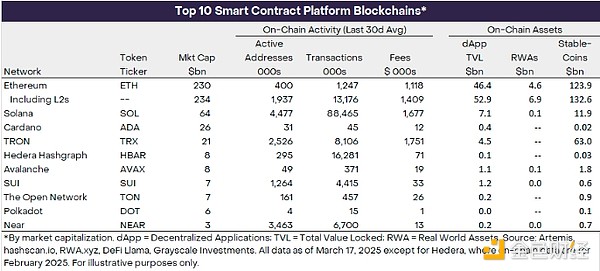
Today, Ethereum hosts thousands of applications and is the largest asset by market cap in our Smart Contract Platforms section of cryptocurrencies. Ethereum has more on-chain assets (such as stablecoins and tokenized assets) than any other leading smart contract blockchain, but has recently lagged behind some other blockchains in terms of on-chain activity (Exhibit 2). Solana, the second-largest network by market cap, has more active addresses, transaction volume, and fees over the past 30 days, but its market cap is only 30% of Ethereum’s.
Figure 2: Ethereum is the largest smart contract platform by market cap
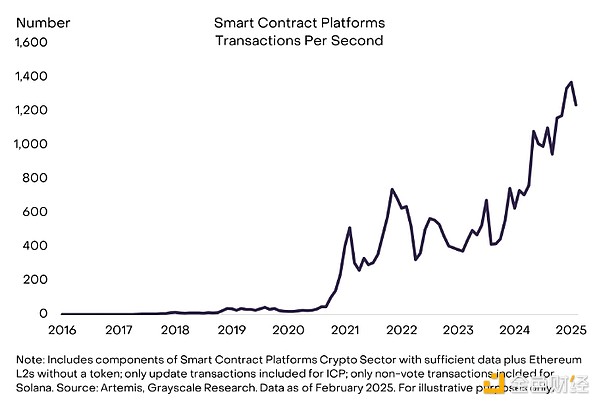
The investment thesis for smart contract platforms is that new applications will bring more users, more transactions, and ultimately higher fees for the underlying protocol.We estimate that transaction volume on smart contract platforms has grown from about 20 transactions per second (TPS) five years ago to about 1,200 transactions per second today, an annualized growth rate of about 130% (Figure 3). By comparison, Visa’s network processed approximately 7,400 transactions in the 12 months ending September 30, 2024. [5] If smart contract blockchains can continue to grow their share of digital payments and are able to establish competitive barriers and maintain pricing power, this will lead to increased fee revenues and potentially higher token prices.
Figure 3: Smart contract blockchains process approximately 1,200 transactions per second
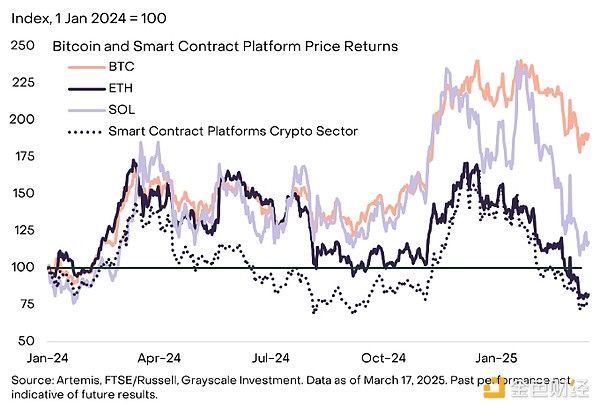
As measured by the FTSE/Grayscale Smart Contract Platform Cryptocurrency Industry Index (Exhibit 4), Ethereum’s performance is broadly in line with its peers. The market sector currently consists of 70 tokens with a total market capitalization of $428 billion. [6] Since the beginning of 2024, the Smart Contract Platform Index has fallen 22%, while the price of Ethereum has fallen 18%. In contrast, the price of Solana has increased by 18% and the price of Bitcoin has increased by 90%.
Figure 4: Ethereum’s performance is roughly in line with its market
How Ethereum makes money
Ethereum monetizes network activity through transaction fees, or “gas fees”, which are the fees required to execute transactions or interact with smart contracts.Unlike Solana and many other blockchains, activity in the Ethereum ecosystem occurs simultaneously on the Ethereum mainnet Layer 1 (L1) and a range of Layer 2 (L2) networks. Ethereum plans to scale to millions of users in this way, as Layer 1 itself cannot scale sufficiently without sacrificing decentralization. If this layered structure works in harmony, it should be able to provide users with high-throughput and low-cost Layer 2 transaction options while retaining the security and decentralization of Layer 1. However, the migration of activity to Layer 2 has an impact on the level of fee distribution across the network, as we will explain below.
Gas fees on Ethereum Layer 1 and Layer 2 networks differ in structure, reflecting the different roles they play in the protocol's scaling strategy. Ethereum Layer 1's fee model has three distinct components:[7]
Gas unit:A fixed computational cost for certain operations (e.g., ETH transfers cost 21,000 Gas).
Base fee:The amount paid for all transactions, in Gwei per unit of gas (1 Gwei is equal to one billionth of an ETH). The base fee is adjusted algorithmically based on demand for each block.
Priority fee (“tip”):An optional fee used to prioritize transactions.
For example, a 1 ETH transfer (requiring 21,000 gas) with a fee of 10 gwei and a tip of 2 gwei would cost:
=21,000*(10+2)=252,000 gwei or 0.000252 ETH
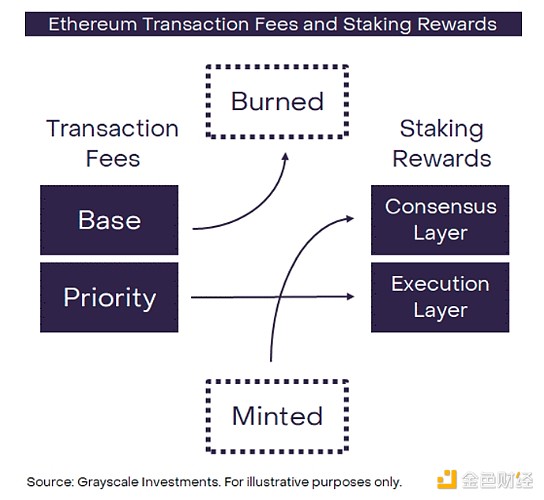
Transaction fees add value to token holders through a mechanism similar to stock market dividends and buybacks. Priority fees are paid to validators as part of their staking rewards, similar to dividends.Base fees are burned to reduce the supply of ETH, rewarding all token holders, similar to a buyback. (Chart 5)
Chart 5: Fees are distributed to token holders through staking rewards and burning
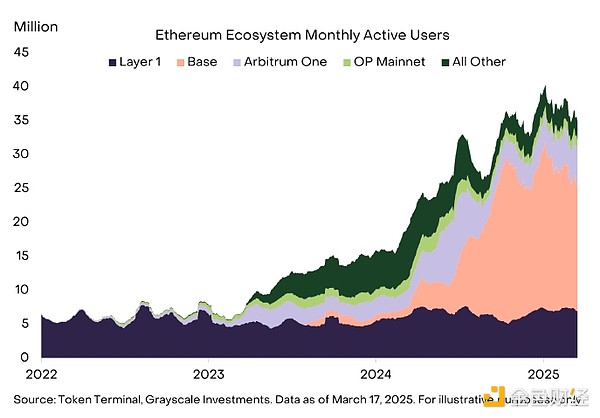
Layer 2 networks such as Arbitrum One and Base also charge transaction fees. Because they rely on the Ethereum Layer 1 network for final settlement and security, Layer 2 is able to charge lower transaction fees and process more transactions per second. However, Layer 2 will pass on some of its fees to Layer 1 as payment for settlement and security services. Last year, Ethereum underwent a hard fork (network update) called Dencun, which was designed to expand the Layer 2 ecosystem. The Dencun upgrade introduced blob[8] transactions, a way for Layer 2 to publish data to Layer 1 at a low cost. The upgrade successfully increased the number of users and transactions on Layer 2 significantly (Figure 6).
Figure 6: Significant growth in Ethereum L2 layer activity
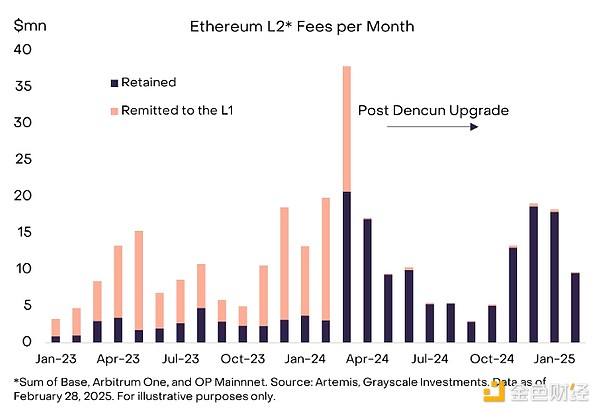
However, the introduction of blob transactions also affected the fee level and distribution across the network. Most importantly, blob transactions reduce the fees that Layer-2 pays to Layer-1 (Exhibit 7). This has led some observers to consider Layer-2 a “parasite” on Ethereum, because in the short term, Layer-2’s success comes at the expense of Layer-1. But if Layer-2 can gain benefits from staying in the Ethereum ecosystem — such as security guarantees and other network effects — then in the long run, a large Layer-2 ecosystem will ultimately bring greater value to the Ethereum network and ETH.
Figure 7: Ethereum L2 pays L1 less fees
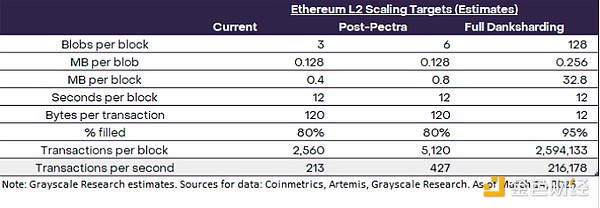
Future upgrades will continue to scale the L1 and L2 layers. The Pectra upgrade is scheduled for April 2025 and will combine enhancements from Prague (execution layer) and Electra (consensus layer). In terms of scalability, Ethereum Improvement Proposal 7691 optimizes Blob storage with a target of 6 Blobs per block, doubling Dencun's Blob capacity. Looking ahead, Ethereum's scalability potential may increase significantly with the implementation of the concept of "full Danksharding" (see Figure 8). [9] This upgrade will expand both the number of blobs per block and the size of each blob, significantly increasing the upper limit of TPS. Figure 8 shows how Pectra and full Danksharding may affect the transaction capacity of Ethereum’s L2 layer.
Figure 8: Future Ethereum upgrades will significantly increase L2 capacity
The Outlook for Ethereum Fees
The outlook for smart contract platform fees is highly uncertain, in part because the technology is still in its early stages and it is unclear how much pricing power a platform like Ethereum will be able to retain over the long term. Smart contract platforms compete with each other and with centralized systems. To maintain pricing power in the long term, they need to provide differentiated features to prevent users from switching to cheaper (centralized or decentralized) alternatives. Although the Ethereum blockchain is slower and more expensive than many competitors, Grayscale Research believes that its unique advantages—including high-value on-chain assets and emphasis on decentralization and security—will help drive adoption and network effects, and ultimately provide Ethereum with some pricing power over time.
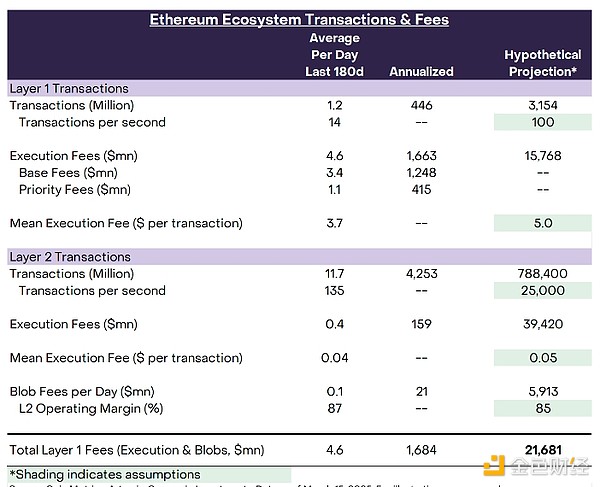
Figure 9 shows an example of how Ethereum can increase fees by adding capacity and maintaining pricing power. We assume an average transaction fee of $5.00 for Layer-1, compared to an average transaction fee of $6.30 since 2019. [10] In the long run, Layer 1 will presumably be used primarily for high-value transactions and those that require a high level of security. For Layer 2, we assume an average transaction fee of $0.05, which is similar to recent experience. We further assume that Ethereum Layer 1 processes 100 transactions per second and Ethereum Layer 2 processes 25,000 transactions per second. These are hypothetical TPS projections that are achievable over the next 3-5 years, given Ethereum’s scaling roadmap and assuming significant growth in overall demand for smart contract-based applications. [11] Under these assumptions, total Ethereum Layer 1 transaction fees would grow from an annualized rate of approximately $1.7 billion over the past six months to over $20 billion (Exhibit 9). While the outlook for transaction fees is highly uncertain, if Ethereum can execute on its scaling strategy and maintain some pricing power, it should technically be able to significantly increase transaction fee revenue. To monitor progress, investors should consider tracking the fundamental variables in this simplified model — namely, TPS for Layer 1 and Layer 2 and average execution fees for Layer 1 and Layer 2. [12]
Figure 9: Ethereum fee revenue can grow with scaling and pricing power
Bigger Pie
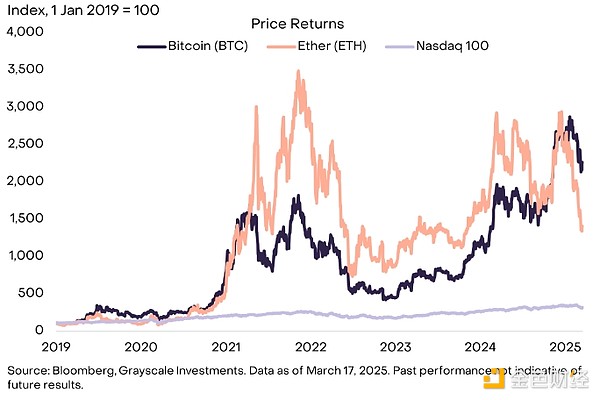
In the last cryptocurrency bull run, Bitcoin and Ethereum initially rose in tandem. However, in 2021, Ethereum’s price rose faster, ultimately achieving a price return roughly double that of Bitcoin from early 2019 to the market peak in November 2021 (Figure 10). Some cryptocurrency investors may have been prepared for a similar pattern in the current cycle—with Ethereum significantly outperforming other cryptocurrencies as the cycle matures—but have been disappointed by its recent weak performance.
Figure 10: Ethereum ultimately outperformed Bitcoin in the last cryptocurrency cycle
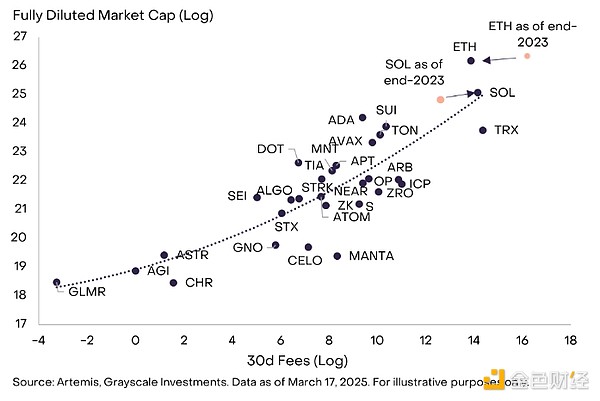
Grayscale Research believes that Ethereum’s underperformance is a healthy sign that the cryptocurrency market is focused on fundamentals. In our analytical framework, the cryptocurrency market differentiates smart contract platforms primarily based on fees. [13] While fees are not translated into token value in exactly the same way across blockchains, they are generally passed on to token holders, and fees are arguably the most directly comparable measure of blockchain activity. Within the smart contract platform cryptocurrency space, Ethereum and Solana both have relatively high fees and market capitalization (Exhibit 11). Since the end of 2023, Solana’s fee revenue and market share within the smart contract platform cryptocurrency space have increased, while Ethereum’s fee revenue and market capitalization have declined. In other words, the market has appropriately repriced the relative value of Ethereum and Solana due to changes in fundamentals. In the simple framework shown in Exhibit 11, Solana’s price has moved up and to the right, and now appears to be roughly fairly valued (“grown into its valuation”). In contrast, Ethereum’s price has moved down and to the left, and today its valuation may be higher than its fee revenue.
Figure 11: Ethereum underperforms Solana due to weaker fee growth
These subtle differences in competitive position are important, but they are far less important than the potential growth of the category as a whole. All smart contract platforms are in the early stages of adoption. For example, Ethereum currently has only about 7 million monthly active users, while Facebook parent company Meta Platforms reports that its applications have 3.35 billion "daily active users" as of December 2024. [14] As adoption increases, smart contract platforms are expected to benefit from compounding network effects. Increased participation not only drives increased transaction volume and fee revenue, but also accelerates developer activity, liquidity depth, and interoperability across the ecosystem. This cycle of adoption and utility can amplify value capture across the category.
The networks that ultimately win are likely to be those that earn the highest transaction fees over time and have favorable structural supply and demand conditions for their native tokens (e.g., due to limited supply growth and structural demand as a collateral asset or medium of payment). Solana, Sui, and a few other smart contract platforms will stand out from the competition with high throughput, low transaction costs, and generally excellent user experience. Ethereum stands out due to its large and diverse application and developer ecosystem, large amounts of on-chain capital, and a culture that prioritizes decentralization, security, and neutrality. We expect these characteristics to continue to attract a large number of users to the Ethereum ecosystem and believe that Ethereum will account for a significant share of economic activity among smart contract platform blockchains in the future.
Notes
[1] Source: Nodewatch.io, Artemis, DeFi Llama, Electric Capital, Grayscale Investments. All data as of March 17, 2025, except developer count which is as of November 2024. Total ecosystem transaction volume covers the following L2s: Base, Arbitrum One, OP Mainnet, ZKsync Era, Starknet, Blast, Linea, Scroll, and World Chain.
[2] Source: Artemis, Grayscale Investments. Data as of March 17, 2025.
[3] For more information, see Grayscale.com’s “January 2025: US Crypto Policy Reshaping Underway” and “February 2025: Progress, Dilemmas, and Opportunities.”
[4] For more background, see “The State of Ethereum and Layer 1 Blockchains: The Story of User-Owned Cities” (Part I and Part II), Grayscale.com
[5] Source: Visa 2024 Annual Report, Grayscale Investments. Visa processed 233.8 billion transactions in its fiscal year, about 7,400 per second.
[6] Source: FTSE Russell Indexes, Artemis, Grayscale Investments. Data as of March 17, 2025.
[7] “Market Flash: Mergers,” September 24, 2022, Grayscale.com.
[8] An Ethereum Blob is a temporary data storage unit (with a retention period of approximately 18 days) that Layer 2 networks use to efficiently batch off-chain transaction data while leveraging Ethereum’s security and reducing fees by approximately 90% compared to permanent on-chain storage.
[9] Danksharding, Ethereum Roadmap, Ethereum.org.
[10] Source: Coin Metrics, Grayscale Investments. Data as of March 15, 2025.
[11] TPS assumptions are not theoretical maximums.
[12] Layer 2 operating margins, i.e., the share of execution fees retained by the Layer, may also change in the future, but this is beyond the scope of this report.
[13] In this report, we exclude discussion of the “monetary premium” (if any) in token valuations. See “The Battle for Value in Smart Contract Platforms”, Grayscale.com.
[14] Source: Token Terminal; Meta reports fourth quarter and full year 2024 results, Meta Investor Relations.
 Joy
Joy


