August is set to be an eventful month for the stock and digital asset markets after a “first-order related” event triggered a sharp sell-off. Bitcoin was not immune to this - it recorded its biggest drop in this cycle, causing short-term holders to “surrender”.
Summary
A “first-order related” event has led to a sharp drop in major assets and stocks recently. Bitcoin was not immune to this - it recorded its biggest drop in this cycle.
The price drop caused the BTC spot price to hit the $51,400 investor active price line, which is an important threshold for investor psychology shifts.
At the same time, leveraged trading also decreased significantly, and the open interest in the futures market fell by 11% in one day. This may lead to further abnormal movements in on-chain indicators.
Massive market sell-offs
General declines that affect global markets are not common, and they usually only occur when the global economic pressure is overwhelmed, large-scale deleveraging and geopolitical risks are intensified. On Monday, August 5, the unwinding of the yen carry trade led to large-scale deleveraging in the market, and investors began to sell stocks and digital assets on a large scale.
Bitcoin fell 32% from its all-time high, which was the largest drop in this cycle.
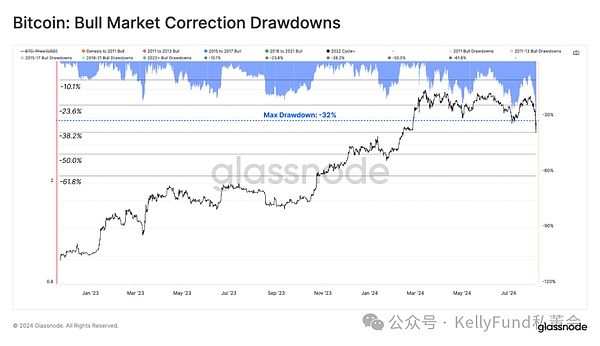
Figure 1: Bull Market Retracement
Here, we will use the Mayer multiple to assess the severity of the price drop. It refers to the ratio between the instant price and the 200-day moving average. Traders and investors generally believe that it is a key indicator that reflects investors' bullishness or bearishness.
Currently, the Mayer multiple is 0.88, which is the lowest value since the FTX crash at the end of 2022.
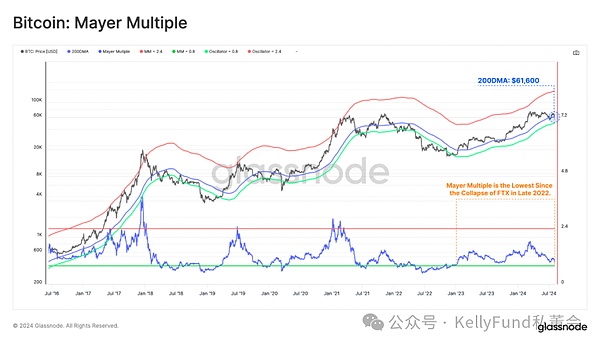
Figure 2: Mayer Multiples in Bitcoin Market
Key On-Chain Price Levels
Among the various relevant indicators on the chain, we can use the cost basis of short-term holders and its movement within the -1 standard deviation range to assess the severity of the sell-off. This helps us predict the profitability of new investors and how it changes during price fluctuations.
Short-Term Holder Cost Basis: $64,300
Short-Term Holder Cost Basis -1 Standard Deviation: $49,600
When the spot price fell into the -1 standard deviation range, only 364 of the 5139 trading days (7.1%) had deviations below the pricing level, highlighting how severe the market decline was.
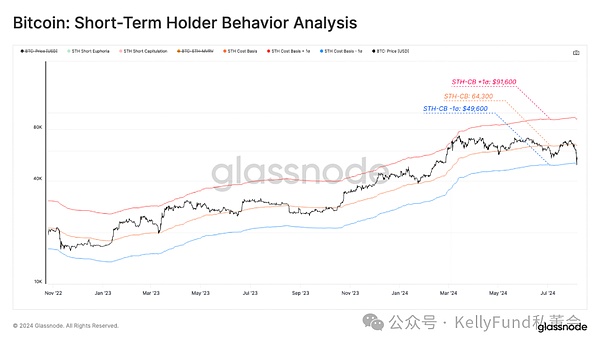
Figure 3: Analysis of short-term holder behavior
We can also evaluate the market through the short-term holder MVRV, which measures the size of the unrealized profit or loss of the new investor group.
Currently, short-term holders can be said to be losing money - they have suffered the largest unrealized losses since the FTX crash. The recent decline has caused them to suffer a serious financial crisis.
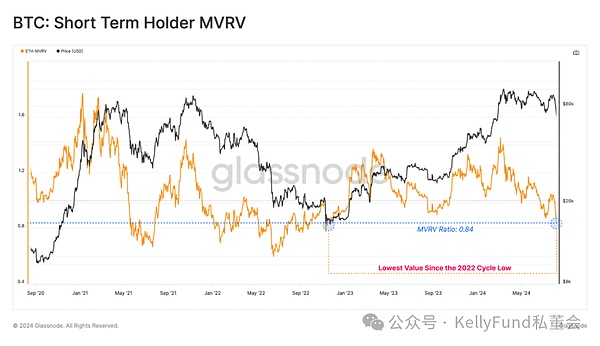
Figure 4: Short-term holders MVRV
If we look at the percentage of profitable supply for short-term holders, we can see that only 7% of the supply is in profit, which is similar to the situation during the August 2023 sell-off.
This indicator is also more than -1 standard deviation below its long-term average, which also shows that new investors have been struggling recently.
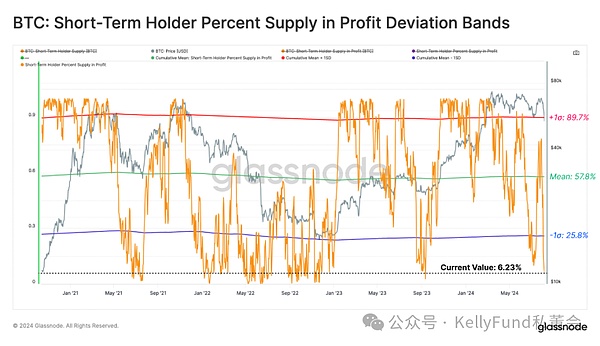
Figure 5: Short-term holder supply profit percentage range
The real market average ($45,900) and the active investor price ($51,200) are both important indicators of the average cost basis of active investors in the current cycle. It is worth noting that these indicators do not take into account those bitcoins that have been lost or have been dormant for a long time.
The height of the spot price relative to these two key pricing levels is crucial, and it has always been regarded as the watershed between macro bull and bear markets.
Active Investor Price: $51,200
True Market Average: $45,900
Currently, the market has found support near the active investor price, which suggests that investors have bought a bottom near their long-term cost basis. However, in the future, if the market continues to fall below these two pricing areas, most of the Bitcoin assets in the market will turn from profit to loss. If so, we may need to re-evaluate the current bull market structure.
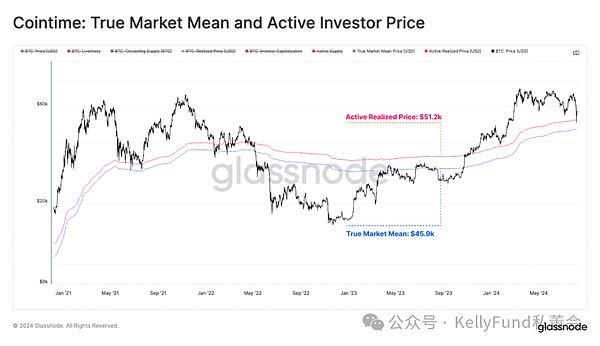
Figure 6: Market Real Mean and Investor Active Price
Realized Losses Soared
In the previous section, we assessed at what point in price the investors would be under great financial pressure. Next, we will analyze the scale of the recent locked losses and get a glimpse of investors' reactions.
The sell-off triggered panic among investors, and the actual losses locked by market participants were about $1.38 billion. In terms of the dollar value, this is the 13th largest event in history in terms of the amount of losses.
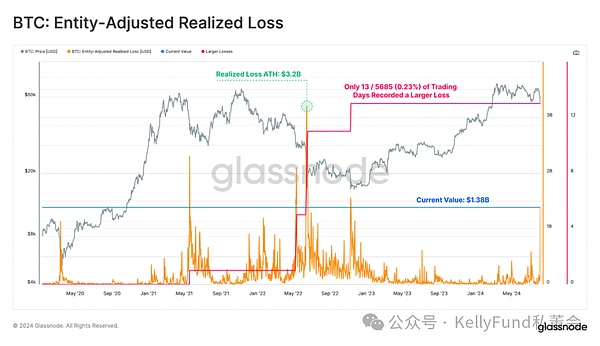
Figure 7: Realized losses of adjusted entities
We analyze the losses suffered by long-term and short-term holders separately to see who is worse off in this crash. Shockingly, as much as 97% of the losses come from short-term holders.
Therefore, we will focus on the short-term holder group and make it the core target group for future loss analysis. <span yes'; mso-bidi- font-size:10.5000pt;mso-font-kerning:1.0000pt;">
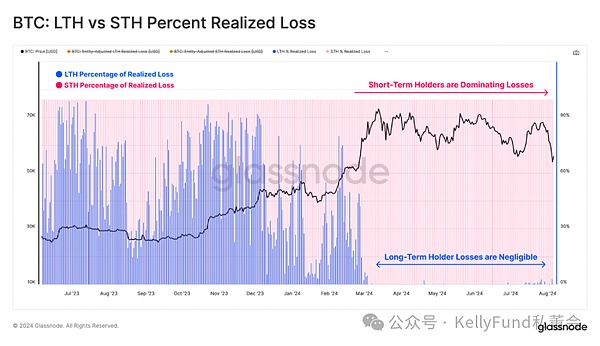
Figure 8: Realized losses of long and short holders
We note that the Z-score change of the actual losses of short-term holders was as high as 6.85 standard deviations at one point - only 32 trading days in history have ever exceeded this level. This highlights the unprecedented severity of this sell-off.
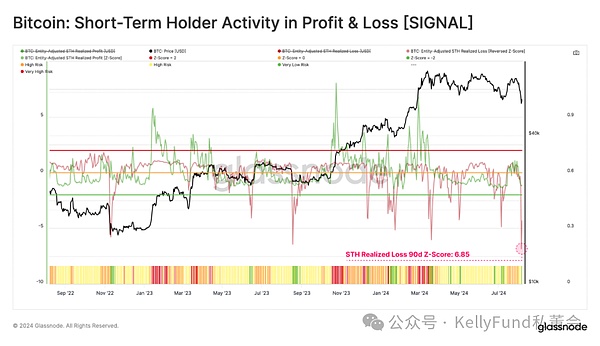
Figure 9: Profit and loss trading decisions of short-term holders
This shows that short-term holders have panicked, as the current spot price of Bitcoin is far below their purchase cost.
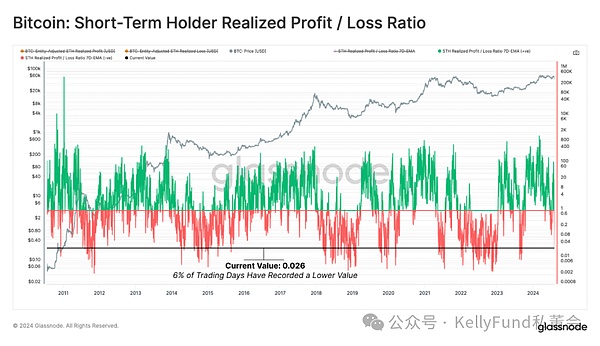
Figure 10: Realized profit and loss ratio of short-term holders
The SOPR of short-term holders has also fallen to an alarming low, as new investors have lost an average of 10% - historically, only 70 trading days have had a lower SOPR than the current level.

Figure 10: Realized profit and loss ratio of short-term holders
The SOPR of short-term holders has also fallen to an alarming low, as new investors have lost an average of 10% - historically, only 70 trading days have had a lower SOPR than the current level.
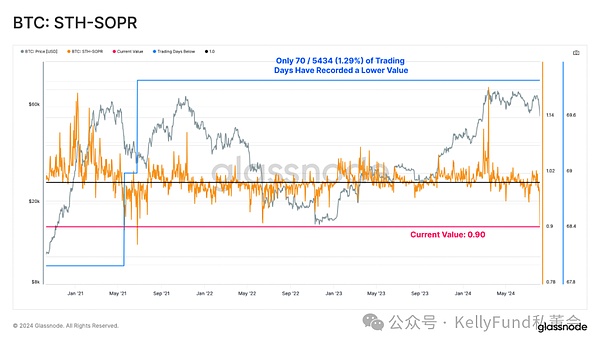
Figure 11: Short-term holders SOPR
Derivatives trading was swept out
In the derivatives market, a large number of long positions were forced to close, with a total of $275 million worth of long contracts being liquidated. In addition, the liquidated short positions were as high as $90 million, or a total liquidation amount of $365 million. This shows that a large number of speculators with high leverage were swept out of the market.
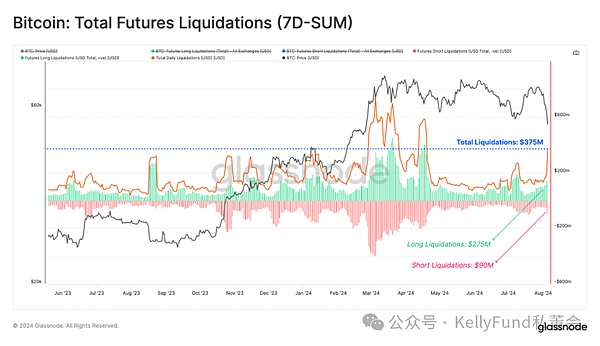
Figure 12: Total amount of contracts forced to close in the futures market
This wave of forced liquidation caused the total amount of open contracts in the futures market to drop by -3 standard deviations, equivalent to -11% evaporation in one day. This may mean that the entire futures market will undergo a complete reshuffle, and the current spot and on-chain data trends will be crucial in the market recovery process in the coming weeks.
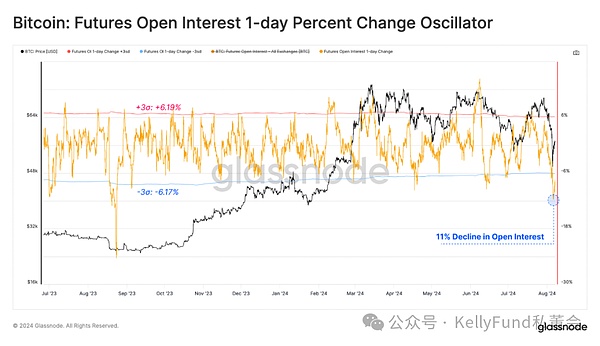
Figure 13: One-day percentage change in open interest in futures markets
Summary
August has been an eventful month for the stock and digital asset markets after the “first-level correlation” event triggered a massive sell-off in the market. Bitcoin fell 32% from its cycle high, a record high, and triggered a massive collapse and panic among short-term holders.
To make matters worse, more than $365 million of contracts were forced to close in the futures market, and the open interest volume fell by 3 standard deviations. This led to a significant reduction in leveraged trading and paved the way for the recovery of on-chain and spot markets. And their movements in the next few weeks will be crucial.
Article source: https://insights.glassnode.com
Original author: UkuriaOC, CryptoVizArt, Glassnode
Original link: https://insights.glassnode.com/the-week-onchain-week-32-2024/
 Brian
Brian
 Brian
Brian cryptopotato
 Catherine
 Beincrypto
 Beincrypto
 Beincrypto
 Bitcoinist
 Beincrypto
 Coindesk
 Nulltx