Author: Katherine Ross, Blockworks; Compiler: Baishui, Golden Finance
Moving with the Bull Market
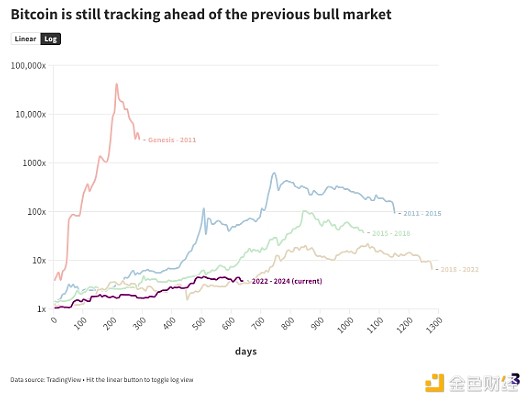
Bitcoin is now more than 640 days into a bull market—if you believe we’re still in one.
Different models give different durations. But by my own calculations, the past three Bitcoin bull markets lasted 1,047 days (2015 to 2018) and 1,278 days (2018 to 2022).
So if Bitcoin is indeed destined to map to these four-year cycles (there are no guarantees), then we’re already more than halfway through the current cycle.
(I’m counting November 9, 2022 as the start, when Bitcoin dropped below $15,670 after FTX shut down withdrawals.)
A few hundred days ago — back in January — Bitcoin’s bull run performance so far has been roughly in line with the previous two cycles: a return of just under 4.5x.
However, during this cycle from 2015 to 2018, Bitcoin’s price quickly heated up. Between January and July 2017, Bitcoin prices surged from $800 to over $2,800.
By the end of 2017, the price of Bitcoin eventually rose to nearly $20,000, setting a record high that was not broken for three years.

It was at this point in time that Bitcoin really took off in the past three cycles
As the brown line in the above chart shows, Bitcoin today more closely tracks the most recent cycle, between 2018 and 2022. Year to date, it has returned 278%, compared to a market return of 244% over the same period.
If the bull run is over, then it would be the shortest bull run in Bitcoin’s history — not counting the two years of initial price discovery after the genesis block.
But if the bull run is still ongoing, and Bitcoin price action is indeed still cyclical, then we have to go higher from now on to map to these patterns, which does align with the outlooks of some analysts.
Based on the length of the first three markets, Bitcoin would still be bullish even into the middle of next year. (NFA, past performance is not indicative of future results, etc.)
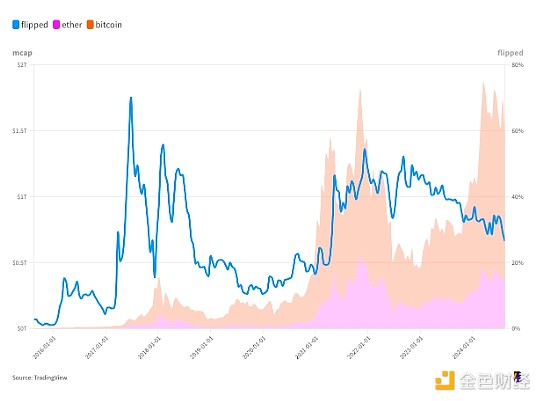
Not all cryptocurrencies are as bullish as Bitcoin. Ethereum, at nearly three and a half years, has not come as far as Bitcoin.

The ETH/BTC ratio, which measures the cost of Ethereum in Bitcoin, has fallen by nearly half since the end of 2021
In the above chart, the orange and pink shaded areas in the background show the market capitalization of Bitcoin and Ethereum, respectively. The areas are stacked, so a flip occurs when the smaller area takes up more than half of the total space.
The blue line tracks progress — it has been steadily falling back since the peak of the 2021 bull run.
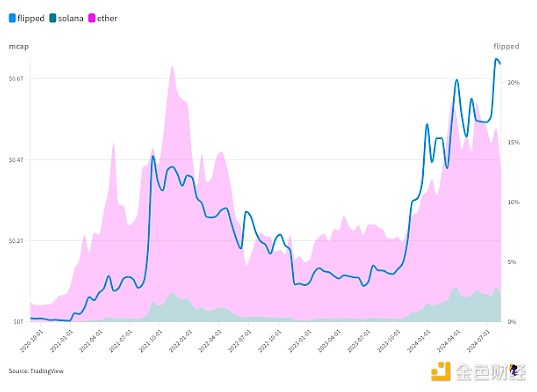
Meanwhile, Solana has never been so close to flipping Ethereum.
This time last year, Solana’s market cap was just 4% of Ethereum’s — or $9.3 billion to $217.2 billion. Now, it’s 22%, worth $66 billion to $307.6 billion.

Here’s the same chart, but showing Solana flipping Ether
It’s worth noting that prominent trader Peter Brandt recently predicted that SOL will rise 100% against ETH in the coming months.
During the previous bear market, the gap between solana and ether was quite large, even if SOL fell further due to its association with Sam Bankman-Fried.
Still, we may need at least half a year of bull market for Brandt's call to come true.
It works for me.
— David Canellis
Cryptocurrency Comeback
“Cryptocurrencies appear to be making a comeback once again.”
This is a direct quote from Barnes and Thornburg on the investment fund’s outlook.
Sponsored Business Content
84% of respondents believe that private investment activity in the space will increase significantly in the coming year.
“59% of respondents also expect the total number of cryptocurrency-specific funds to increase over the next 12 months. This is a change from last year, when the majority of respondents said that the current state of the cryptocurrency market has had a significant negative impact on their organization,” the report noted.
Barnes and Thornburg surveyed nearly 140 venture capitalists, private equity, hedge funds, and investors — including U.S.-based limited partners and sponsors. Perhaps not surprisingly, artificial intelligence is another hot sector for these folks (although recent market action suggests that AI deals may have dried up for some investors).
Two main factors have contributed to the shift in attitudes: continued institutional adoption (duh) and a rebound in cryptocurrency prices.
“It’s been a year and a half since the FTX crash, and we’ve seen a significant recovery in Bitcoin and other cryptocurrencies,” said Scott Beal, partner at Barnes & Thornburg.
“The SEC’s approval of a Bitcoin ETF is a big deal for the industry and could also increase allocators’ appetite for investing in private crypto funds and other non-regulated products.”
Speaking of Bitcoin and Ethereum ETFs, the latter has managed to bear the weight of the positive momentum as Bitcoin ETFs continue to see some outflows.
“Given the challenging environment for spot ETFs (as evidenced by recent BTC spot ETF flows) and considering expected outflows once the Grayscale Ethereum Trust converts to an ETF, the outlook for an ETH spot ETF looks positive,” wrote Matteo Greco, research analyst at Finequia.
The 12-month outlook mentioned in the Barnes and Thornburg report happens to be another potentially bullish time frame for cryptocurrencies, depending on the outcome of the U.S. presidential election.
There are also reports that current Vice President Kamala Harris' campaign is trying to reach out to cryptocurrency industry leaders, which could influence developments.
However, former President Donald Trump's Republican campaign was more vocal in its support for cryptocurrencies. FalconX's David Lawant recently opined that the US election could help break the current trend in cryptocurrencies.
Because, despite the possibility of positive catalysts, we are still at an awkward moment in price action.
Finequia’s Greco wrote: “Total open interest in Bitcoin has fallen by about 12% since the end of July, from $4.6 billion to $4.1 billion. This decline highlights the large number of liquidations that have impacted digital asset markets, creating a snowball effect that has led to lower prices, and reflects the strong correlation between market activity on centralized and decentralized exchanges and recent price action.”
“Reducing leverage, while leading to short-term price declines, is often viewed positively by markets as it reduces the risk of excessive leverage, which could lead to a more severe market correction if excessive leverage grows further and reaches unsustainable levels.”
There’s a lot of potential for the future, but it’s not necessarily helpful right now.
But it’s also August and we’re still in vacation mode. You know what we say: keep swimming.
— Katherine Ross
Q: What does summer do to the noise signal?
Sometimes, it dulls the noise signal. Sometimes, it makes it really loud.
It certainly makes the intense sell-offs more dramatic and scary, but this summer’s rally has still been strong.
Sometimes, it’d be nice if the noise was just a mundane hum, but this is crypto and we’re all in it 24/7, so we always have to be prepared for the scariest.
Just don’t get too used to it.August is traditionally a slower month, but I have a feeling September will kick-start a lot of the action.
— Katherine Ross
This is the second summer of the bull market, and some dampened enthusiasm is to be expected.
When the market is really hot, positive news like testnet launches, partnerships, and usage milestones can have a day-to-day impact on price.
In our current moment, all of these things barely get any attention. But people still expect any news to be good.
News is news now. Even negative news. The market is going through a lot of changes - which may be the most bullish thing about crypto right now.
With crypto at current levels, and with all the uncertainty on the macro, regulatory, and political fronts, how bad can things really get?
— David Canellis
 JinseFinance
 JinseFinance
 Weiliang
 Alex
Alex Others
 Others
 Coindesk
 Bitcoinist
 Bitcoinist
 Cointelegraph
 Cointelegraph