Author: Glassnode, Alice Kohn; Compiler: Songxue, Golden Finance
Abstract
Ethereum and altcoins rallied strongly last week in response to the approval of a series of Bitcoin ETFs. For the first time since October 2022, ETH outperformed BTC.
There has also been an increase in activity in the ETH derivatives market, suggesting a possible change in capital flows. Bitcoin still dominates in terms of open interest and volume, but Ethereum has regained some of its losses since the ETF was approved.
We also evaluate the relative performance of Solana, scaling tokens, and various industry indices against BTC and ETH as a measure of risk appetite in a post-ETF world.
Speculation in the digital asset market increased ahead of the Bitcoin ETF’s approval, followed by widespread sell-off news events in the days that followed. As we discussed, the market is arguably pricing this event to near perfection. At the time of writing, Bitcoin price has dropped 18% to $39,500.
Despite this correction, investors continue to look to the future and ask questions like: Who's next? Will there be a new round of speculation about Ethereum ETF approval? Will Solana continue to outperform ETH and BTC? Or is there an appetite for risk and smaller market cap tokens right now?
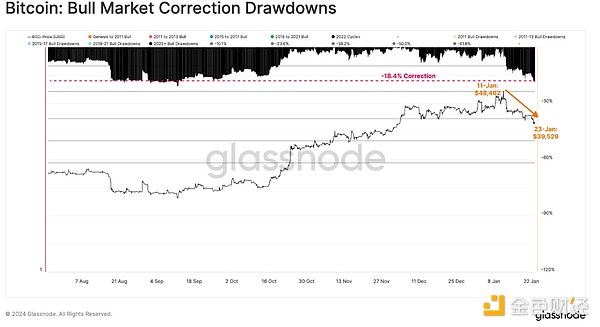
After ETF speculation< /h2>
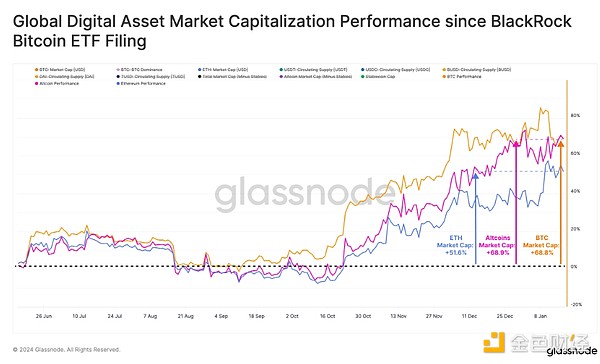
The digital asset market has performed very strongly since mid-October, with ETF speculation and capital rotation dominating.
Since BlackRock first filed for an ETF, Bitcoin’s market capitalization has increased by +68.8%, and the total altcoin market capitalization has also increased by +68.9%. However, Ethereum’s relative momentum is weaker, underperforming the broader altcoin space by 17%.
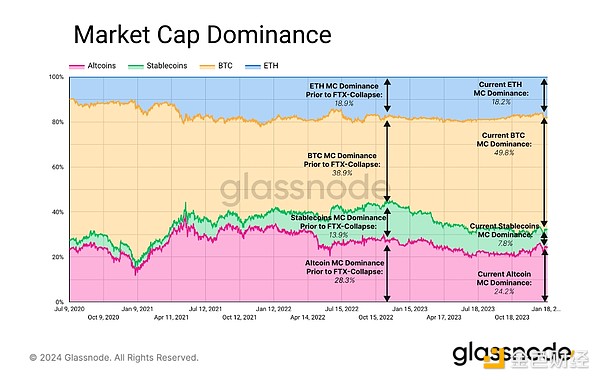
Narrow the scope,< span style="color: rgb(0, 112, 192);">We can see Bitcoin becoming more and more dominant overall over the past few years. Since Since the FTX crash in November 2022, BTC’s market capitalization dominance has increased from 38.9% to 49.8% .
On the other hand, ETH maintains its market capitalization dominance, accounting for 18.9% to 18.2%. In the cryptocurrency market, it was mainly altcoins that lost market share, with their market capitalization dominance falling from 28.3% to 24.2%, while the share of stablecoins also fell from 13.9% to 7.8%.
Shortly after the Bitcoin ETF was approved, multiple issuers have submitted or expressed willingness to advocate for an Ethereum spot ETF. Although it may be more challenging to get approval for an ETH-based ETF as the U.S. Securities and Exchange Commission may view Ethereum more as an investment contract, the market appears to be expressing optimism.
ETH price has surged more than 20% relative to BTC in recent weeks, setting a quarterly high since late 2022 , the strongest monthly and weekly performance.
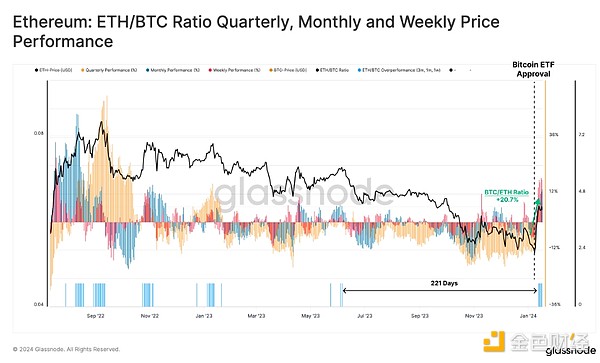
Meanwhile, market cap dominance of ETH and altcoins in general has seen a small rebound. ETH’s market capitalization dominance increased by 2.9% compared to Bitcoin.
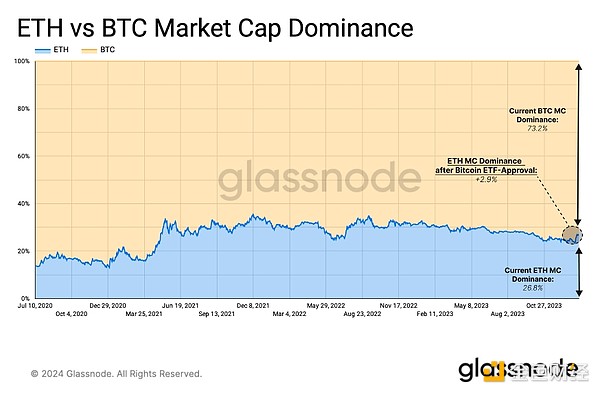
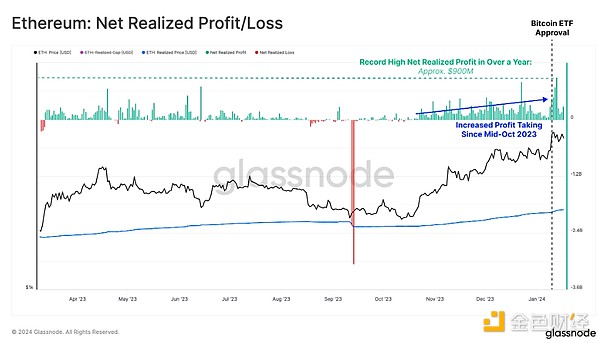
At the same time, The amount of net profit locked in by ETH investors also hit a multi-year high. Although profit-taking has increased since mid-October, the peak on January 13 was over $900 million/day, consistent with investors taking advantage of "sell-off news" momentum.
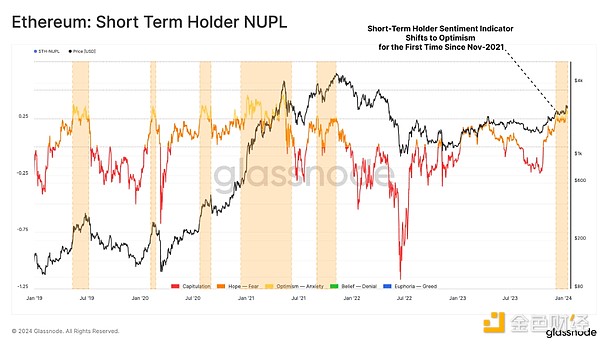
A positive market for ETH Sentiment is supported by another indicator: Net Unrealized Gains and Loss (NUPL) for short-term token holders. STH-NUPL exceeded 0.25 for the first time since ATH in November 2021.
This shows that the market sentiment for ETH is gradually warming up, but the market tends to Pause and digest profit-taking allocation pressure. Historically, this shift in sentiment among short-term holders has coincided with local peaks during macro uptrends.
Derivatives Shift Focus
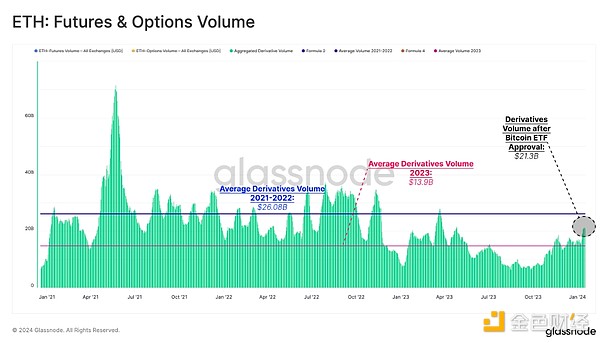
Given Ethereum’s recent rally, it’s worth checking its derivatives market to gauge how the leveraged market is reacting. In recent weeks, we can see a significant increase in trading volume in futures and options contracts. The total trading volume of the ETH market is $21.3 billion per day, which is above the average trading volume in 2023 ($13.9 billion), but still far from the typical levels in 2021 to 2022.
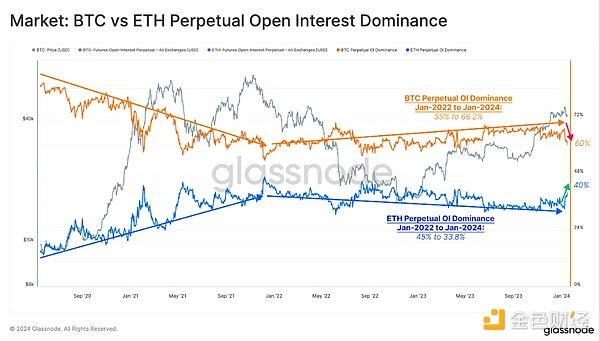
Considering that futures have not yet Unwinding the dominance of the contract, we can also compare the relative size of the ETH derivatives market to that of BTC. In January 2022, BTC perpetual swaps accounted for 55% of open interest, which has since risen to 66.2%.
In contrast, ETH open interest dominance dropped from 45% to 33.8% between 2022 and 2024. However, after the ETF was approved, ETH regained some market share, with its dominance rebounding to around 40% by this metric.
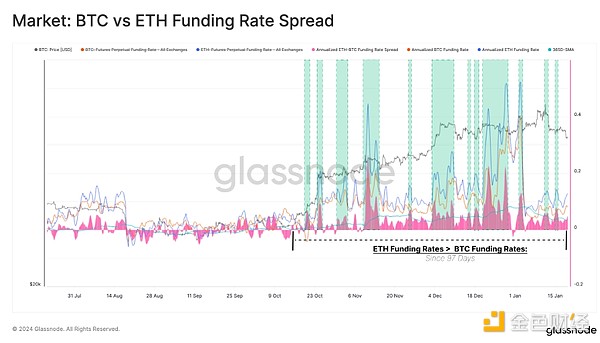
ETH futures also have a relatively large funding rate premium, indicating a relatively high risk premium compared to Bitcoin. ETH funding rates have surpassed BTC over the past three months, but have not seen significant growth in recent weeks. This suggests that speculative interest in Ethereum’s relatively high price movement has not yet increased significantly.
Interestingly, when the ETH-BTC funding rate spread spikes above its 1-year average, it typically coincides with local peaks in ETH price.
Ethereum is still a copycat currency?
The digital asset market is extremely competitive. ETH not only competes with Bitcoin for capital flows, but also competes with other Layer 1 blockchain tokens for capital flows.
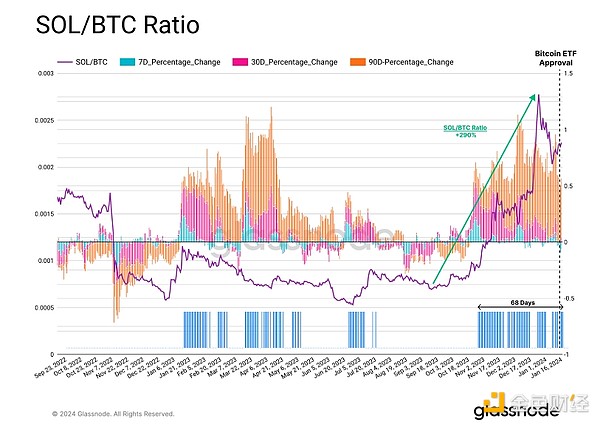
Solana (SOL) has had a great year in 2023, with strong price performance last year despite suffering a major setback due to its association with FTX. SOL has gained considerable market share over the past 12 months, with the SOL/BTC ratio fluctuating between 0.0011 and 0.0005 SOL/BTC.
The SOL/BTC ratio has increased by 290% since October 2023, significantly outperforming ETH during this period. Interestingly, unlike ETH, SOL’s price did not see any significant upward re-rating following the BTC ETF’s approval.
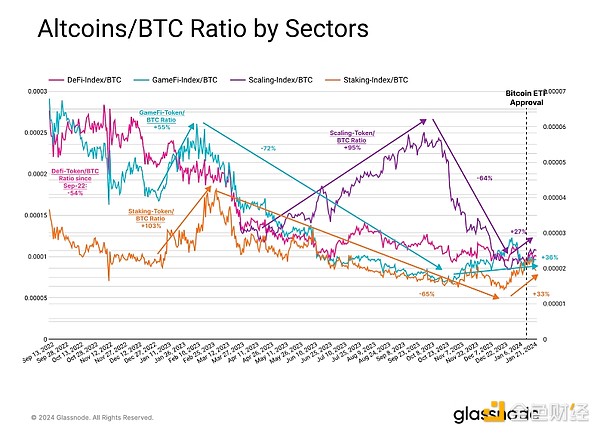
As at the beginning of this report As stated, Since the BlackRock Bitcoin ETF filing, the altcoin’s market value has increased by nearly 69%. When we segment the altcoin market into different sectors, it is clear that the main drivers of this trend are related to tokens related to Ethereum scaling solutions such as OP, ARB, and MATIC.
Stake and GameFi tokens have also outperformed BTC since the end of last year. The Stake-Token/BTC ratio rose by 103% at the beginning of 2023, but then fell by 65% until it bottomed out in December. Likewise, the GameFi-Token/BTC ratio increased by +55% in February 2023 and has since declined by 75%.
The Scaling token reached peak performance later in the year, with the Scaling token/BTC ratio rising by 95% in Q2 and Q3 of 2023. It’s worth noting that the Arbitrum token was only launched in March 2023.
After the Bitcoin ETF was approved, all indexes posted small gains, which once again shows that as Bitcoin The coin was sold off after the news broke, and there is a certain risk appetite.
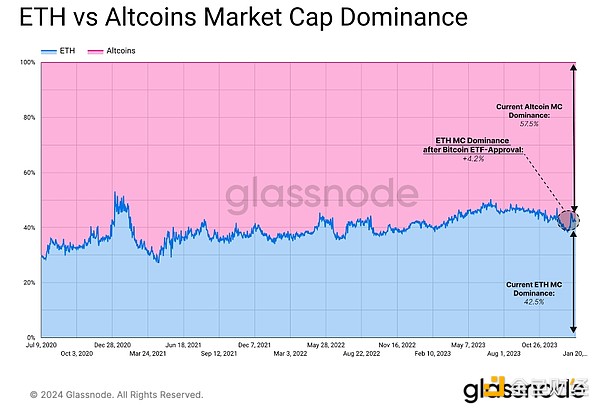
However, altcoins have underperformed in recent weeks compared to ETH. ETH outperformed altcoins overall, increasing its global dominance by 4.2%. This makes ETH the biggest winner of market movements after ETF approval.
Summary
The approval of a new Bitcoin ETF has become a classic sell-off news event, leading to a volatile few weeks for the market. ETH has performed strongly and emerged as the short-term winner. ETH investors’ net profits have reached multi-year highs, indicating some willingness to sell off potential ETH ETF capital rotations for speculation.
Solana has also emerged as a strong competitor in the 2023 Layer 1 blockchain race, although it has not seen any significant strength in recent weeks. The altcoin industry as a whole is also gaining some momentum from the ETF excitement, and investors will begin to face another wave of speculation.
 JinseFinance
 JinseFinance
 JinseFinance
 JinseFinance
 JinseFinance
 JinseFinance
 JinseFinance
 JinseFinance
 JinseFinance
 JinseFinance
 JinseFinance