Author: Murphy Source: X, @Murphychen888
Yesterday, I shared the transformation of the bull-bear cycle from the realized market capitalization waveform data of BTC holders. Some friends left a message in the comment area, asking whether the approval of ETFs would interfere with the accuracy of the data. We can use another set of data to answer your temptation.
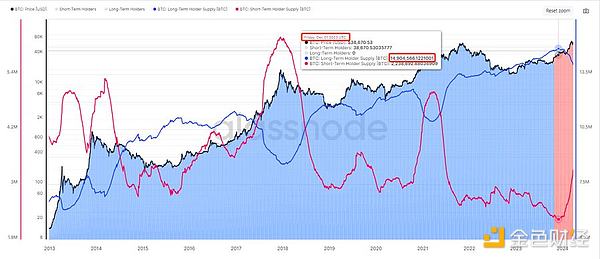
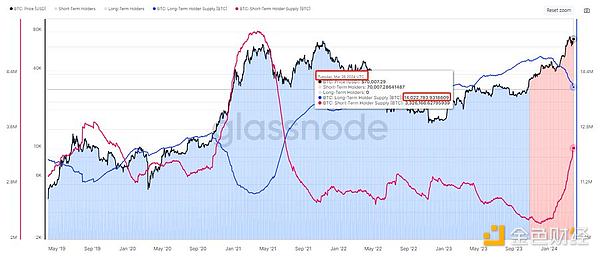
The picture below shows #BTC circulating chips held by long-term holders (LTH: blue line) and short-term holders (STH: red line) respectively The change curve of the number of chips. We can see that on December 1, 2023, LTH started to turn downward from its highest point, with a peak holding of 1,491,000 BTC that day; as of March 26, 2024, LTH held 1,402,000 BTC, a total reduction of 89,000 BTC. This includes the 270,000 units sold by Grayscale.


As we all know, the BTC retained in Grayscale GBTC are chips from the previous cycle and also belong to LTH; the adoption of ETF has contributed to this part of LTH chips Expedite the speed. But on the other hand, if the ETF had not been approved, there would not have been so many outside institutions entering the market, and the price of BTC would not have reached a new high before the halving for the first time in history. The BTC purchased by these newly entered funds also belong to STH;
Therefore, it can only be said that the adoption of ETF has changed the rhythm of the traditional bull market and caused costs. An "atypical" bull market in this cycle. But the essence behind the transformation of the chip structure is the supply and demand relationship of the entire market. The buying and selling of ETFs itself is included in this underlying relationship. The challenge for analysts is to identify periods in atypical bull markets when selling pressure may reach a critical point of oversaturation (LTH distribution) and exhaustion of new demand (STH acceptance), commonly known as "Escape from the top".
In addition, some friends mentioned that the development of the BTC L2 ecosystem in this cycle has caused the transfer of BTC in many wallets (earning income through staking) , for example, Meilin has accumulated nearly 40,000 BTC in the ecosystem; but among the mobile chips, there are both LTH and STH.

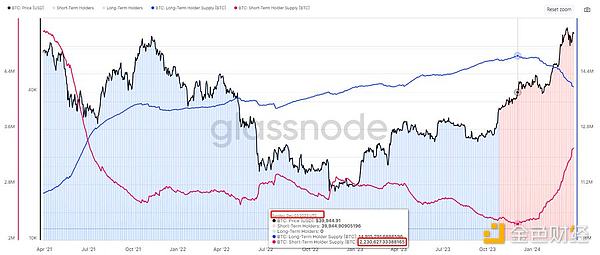
From the picture above, we can see that STH started to turn upward from the lowest point on December 3, 2023, and the low value held on that day was 224w BTC; as of As of March 26, 2024, STH holds 332,000 pieces, a total increase of 1,080,000 pieces. Among them, 890,000 are transferred from LTH to STH, and the remaining 190,000 are transferred between STH. The factor L2 only accounts for 3.7% of the overall data weight, so it is indeed an influencing factor, but from the data point of view, the "interference" to the overall judgment conclusion is not great.
Yesterday we looked at the bull-bear cycle transition through currency age. Today we look at another data: BTC long-term and short-term holder supply cycle indicators.
By observing, we can find that at the peak of previous bull markets, the supply of long-term holders (LTH) fell by 14% to 25%, which shows that There is some level of selling pressure in every cycle. Conversely, short-term holder (STH) supply tends to reach its maximum at cycle tops, increasing between 83% and 127% from its cycle bottom.

In March, LTH supply fell by -4.2% and STH supply rose by 36%. If we use a simple estimate, assuming these retracements Or the extent of the increase reflects the supply and demand turning point at the high point of the cycle. It can be concluded that the current market has gone through about 30% of the typical selling cycle. It is similar to the point made yesterday that the bull market has completed 1/3.
Usually, analysts have different views on how to distinguish cycles. But I personally would exclude the transition period from bear to bull, that is, from January to the end of November 2023, when BTC goes from US$18,000 to US$38,000. It has been about 4 months since the turning point in LTH supply on December 1, 2023, which can be regarded as a landmark event that this round officially entered the bull market cycle. If calculated based on this, the first stage of this bull market may still have about 8 months left.
Why is it said to be the first stage? Is there a second stage? I think this is possible. It depends on whether the impact of the Fed's interest rate cut cycle and the US election cycle on the market overlap, or whether there is a longer interval. If the interval is longer, the possibility of a bull market double top or multiple tops cannot be ruled out.
For specific logical analysis, you can refer to Ni Da @Phyrex_Ni 's large-scale topic pinned post - "What conditions need to be met during the climax period of a bull market rise?" ”
I won’t go into details here. What we are currently focusing on is the high point of the first stage of this bull market (if there is a second stage, data will still speak for itself).
The judgment of the cycle determines our investment decisions. Although the discussion from the time dimension is not necessarily accurate, it is also impossible to predict the specific price point. . But at least we have a clear understanding of the general direction. For example, knowing that the bull market has entered the "mid-term", you should strengthen your confidence in holding it. If there are promising potential coins, there is no need to panic even if there is a correction. Or you can also make appropriate arrangements for high-quality coins that have not followed the rise in the early stage, because ALT often has It is in the middle and late stages of the bull market that the full-scale outbreak mode begins.
 JinseFinance
 JinseFinance
 JinseFinance
 JinseFinance
 JinseFinance
 JinseFinance
 JinseFinance
 MarsBit
 Cointelegraph
 Cointelegraph
 Cointelegraph