Author: Rakesh Upadhyay, CoinTelegraph; Compiled by Baishui, Golden Finance
ETH has been underperforming Bitcoin by a wide margin. The second-largest cryptocurrency by market value hit its lowest point against Bitcoin in three and a half years on September 18, with the last time it was seen in 2021. The big question is whether this low provides a buying opportunity, or will Ether continue to underperform.
Bitcoin has been trading sideways for several months, but some analysts expect prices to break out of this range and hit a new all-time high in the fourth quarter of this year.
However, analysts do not expect the same to happen with Ether, which is currently trading well below its all-time high. Polymarket, the world’s largest prediction market, shows an 85% chance that Ether will not hit a new all-time high in 2024.

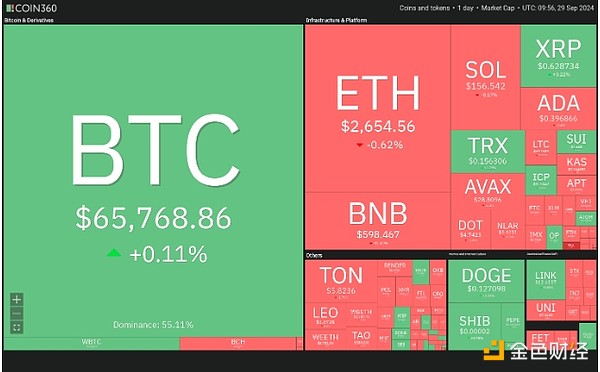
Cryptocurrency market data daily view. Source: Coin360
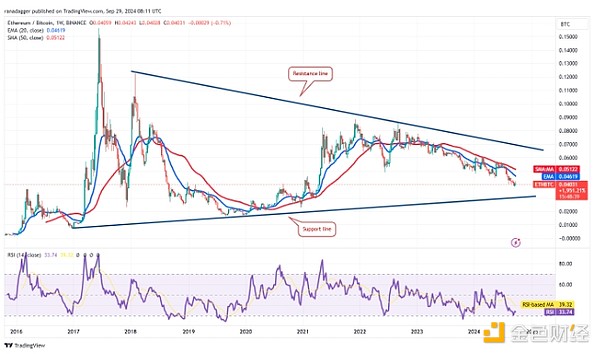
It’s not all gloom and doom for Ethereum bulls. In a blog post on Sept. 17, the Chief Investment Officer (CIO) of Bitwise Asset Management said that Ethereum could be a “potential contrarian bet by the end of the year.” Can Ethereum stage a comeback and outperform Bitcoin? Let’s analyze Ethereum’s chart relative to Bitcoin to find out. ETH/BTC Weekly Price Analysis The long-term chart of the trading pair shows the formation of a symmetrical triangle pattern, which suggests indecision between the bulls and the bears. The bulls are defending the support line, while the bears are making a strong defense at the resistance line.

ETH/BTC weekly chart. Source: TradingView
Both moving averages are trending down and the relative strength index (RSI) is close to the oversold zone, which shows that bears are in command. The ETH/BTC pair is likely to drop to the support line, where buyers are expected to step in.
If the price rebounds off the support line and breaks above the moving averages, it will indicate that the trading pair is likely to stay inside the triangle for a while. The next trending move may start with a breakout above or below the triangle. The rebound above the triangle gives the pair a pattern target of 0.18 BTC, above the current all-time high of 0.15 BTC.
ETH/BTC Daily Price Analysis
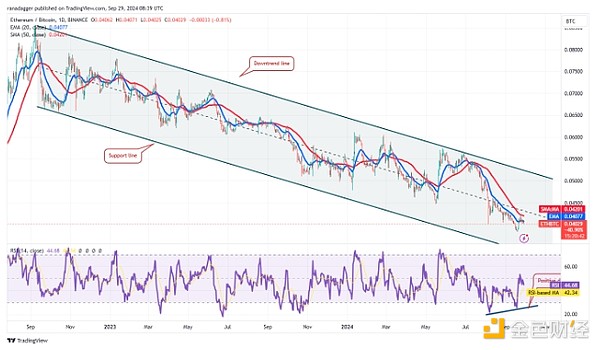
The pair has been trading inside a descending channel for several months, forming a series of lower highs and lower lows.

ETH/BTC daily chart. Source: TradingView
A minor positive for the bulls is the positive divergence seen on the RSI and the 20-day exponential moving average (0.04 BTC) has started to flatten out. This suggests that the selling pressure could be easing off.
A breakout and close above the 50-day simple moving average (0.04 BTC) will signal the start of a move towards the downtrend line. A breakout and close above the channel would signal a change in trend.
This positive view would be invalidated in the short term if the price continues lower and breaks below 0.038 BTC. This could potentially drop the pair to the support line of the channel.
 JinseFinance


