Author: Matthis Herbrecht & Achim Struve, Outlier Ventures Token Team; Translation: Golden Finance xiaozou
1, Recommendations on Ecosystem Incentive Activities
Execute a multi-stage airdrop strategy:Follow Optimism's multi-round airdrop model to maintain long-term user stickiness. This approach helps retain users after the initial token issuance and encourages long-term participation in the ecosystem.
Allocate important resources to grant programs:Use part of your incentive budget to fund developers and builders. This medium-term approach helps build a strong Dapp ecosystem, which is critical to user retention and sustainable growth. Then, implement a strong monitoring system to track key metrics and analyze the impact of incentives. This will enable data-driven adjustments and continuously optimized grant programs.
Focus on lowering the cost per user over the long term:The goal as the network matures is to lower the cost per monthly active user (MAU). Optimism’s approach of combining recurring grants with strategic airdrops results in a relatively low cost per MAU of $304. Set a long-term goal of reaching similar or better efficiency in 12-18 months.
Prioritize ecosystem development before token issuance:Think about Base’s approach, which focuses on culture, builder stickiness, and ecosystem development, all without the need for a token. Allocate resources in the form of targeted small grants to founders and projects whose goals align with the ecosystem vision, rather than relying solely on token incentives.
Balance short- and long-term incentives:The goal is to maintain a balance between short-term incentives, such as airdrops, and long-term incentives, such as donation grants and ecosystem funds. This balance will attract initial users while maintaining long-term growth.
Implement user retention strategies beyond economic incentives:Develop a strong community culture that focuses on successfully attracting and retaining developers, creating engaging experiences and events, and improving the user experience similar to Base. This helps maintain user stickiness, even in the absence of ongoing economic incentives.
2, Introduction
Layer 2 (L2) networks have become a key solution to the blockchain scaling challenge. As these networks compete fiercely for market share, incentive programs (particularly grants and airdrops) have become a key factor in the growth strategy of each network. Given the huge amount of resources invested, let's take a step back and examine their effectiveness through the analysis of this article.
(1) Scope of the study
Here we focus on two main incentive mechanisms: grants and airdrops.
The analysis excludes application-level incentives such as liquidity mining or yield strategies to better maintain a clear focus on L2 blockchains.
The data used in our study covers the period from 2021 to September 2024.
(2) Key Performance Indicators
We considered two main indicators to evaluate the performance of the incentive program:
Revenue Generation:Ideally, revenue growth should at least offset part of the cost of the incentive program, showing a positive ROI, indicating that it is a successful program.
User Acquisition+Retention:Achieving sustainable short/mid-term user growth at the lowest possible cost. Therefore, we will track the evolution of Monthly Active Users (MAU).
Revenue generation and user acquisition are closely linked. More MAUs increase network activity and transactions, which in turn improves sequencer earnings. Higher yields mean that this is a valuable network that is able to attract and retain users, which in turn increases yields. This positive feedback loop is critical to long-term success.
By closely tracking these numbers, we can clearly understand the incentive activity of each chain and its impact on these two metrics.
(3) Understand the context and constraints before diving in
As with any deep dive into complex data, it is important to note certain constraints:
Layer 2 lacks a clear incentive dashboard that shows grant details, such as dates and exact token amounts. Different ecosystems also view airdrops and grants differently. For example, some ecosystems consider private investments in tokens or equity as grants. However, in our research, we do not classify these as grant programs. The lack of transparency and multiple definitions of grants and airdrops make this data particularly difficult to collect.
The Optimism Superchain and ZK stack are not considered, only the main chain is considered. Base receives grants from Optimism, but that grant is not factored in.
The definitions of grants and airdrops can overlap, especially in the context of Optimism.
Incentives can also impact other metrics, such as protocol TVL or number of applications, but we chose to focus on MAU and chain revenue as the primary metrics for evaluating L2 incentives. These metrics were chosen because they are easy to quantify and the data is readily available from public sources. While MAU and chain revenue are correlated, they also provide valuable insights into the short-term and long-term impacts of incentives. In the end, it is best to stick to 2 or 3 metrics to keep the analysis understandable.
While MAU and revenue are closely correlated, other factors also play a critical role. Community culture, narrative, marketing, technological progress, and macroeconomic conditions all have a significant impact on the results. However, this study takes a simplified approach to examine the impact of incentives in a more isolated way.
The cost of incentives is calculated based on the USD value of the token on the date of token issuance.
Data on recent L2s (such as Starknet, Blast, or ZK Sync Era) are all very recent, so it is difficult to draw conclusions in the short term.
With this background, let’s do a deeper analysis.
3. Impact of incentives on MAU (monthly active users)
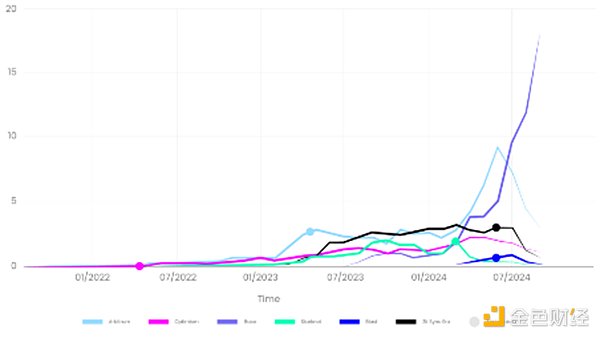
Let’s start with a simple chart showing the number of monthly active users for each L2.

The graph shows:
Base is the only chain that has continued to grow its monthly active users by an average of 56%, and its retention rate has not dropped significantly, while other chains have seen a decline in users in recent months.
All other L2s have experienced a decline in users in recent months.
After the airdrop event, the monthly active users of the latest chains such as ZK Sync Era, Blast and Starknet have decreased, while L2 solutions such as Optimism and Arbitrum have seen a slight increase in monthly active users.
We believe there are four main reasons:
Recently, we have seen an increasing number of L2 solutions come online. As a result, the number of users has been diluted between these L2s and their respective airdrops. This trend may explain why new L2s have difficulty retaining users after the airdrop.
Another explanation may be due to the grant programs of Arbitrum and Optimism, which are effective strategies for long-term user retention. The upward trend after the airdrop suggests that these projects have successfully maintained user stickiness, unlike emerging L2 solutions that have difficulty maintaining a user base. Based on this, we can assume that this is due to the lack of grant incentives and/or the small ecosystem with few applications.
As chains become more and more mature, culture is a key factor in differentiating L2s. Optimism, Arbitrum, and Base may have an advantage in this regard because they have been around longer. The same is true for the security/decentralization stage, with two chains (Arbitrum and Optimism) still in stage 1 according to “L2beat.”
Base has no token. People expect airdrops and don’t leave Base because it’s the last large L2 without a token; people enjoy the culture and activities of Base; and trust Base because Coinbase is behind it.
However, MAU is not the only metric to consider. Let’s look at the impact of incentive activities on revenue.
4The impact of incentives on revenue
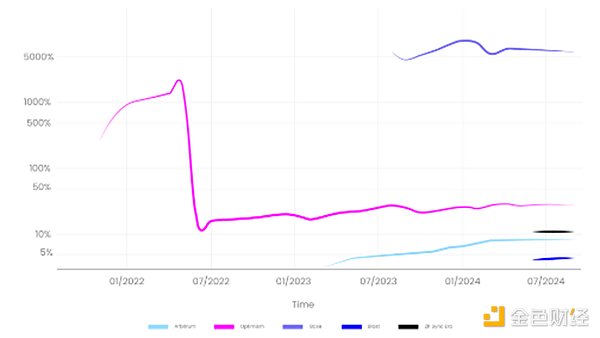
Now, let’s look at the second metric to be discussed in this article - revenue. To analyze the second metric, we reviewed the total incentive distribution (in USD) and compared it to the total revenue generated by the chain (in USD).
Since chains usually start incentive activities immediately after launching mainnet, it is impossible to compare the presence or absence of these activities. We decided to divide the cumulative revenue of each L2 by its cumulative incentives to get a more comprehensive data.

The following points can be drawn from this analysis:
There are two chains that have higher revenue than their incentive spending: Base is performing very well, with low incentives and high activity leading to high revenue. For every dollar spent on incentives, about $50 in revenue is created. Optimism also maintained a net positive return before the first round of airdrops through the grant program.
Chains that conduct airdrops generate less revenue than incentives spent: For every $100 spent on incentives, Blast, Arbitrum, zkSync, and Optimism generate $5, $8, $11, and $27, respectively. Notably, among the chains that provide the most grants, Optimism and Arbitrum have seen increasing numbers of monthly active users over time. In contrast, the number of monthly active users for other chains has remained flat, and these chains have had almost no grant activity.
We can draw two conclusions:
In the short term, airdrops hinder the net benefits of each L2 (the benefits in USD terms are higher than the incentive costs).
Based on the available data, older chains that actively and frequently provide grants to builders tend to reduce the average incentive cost per user over time.
5、Incentive cost per user
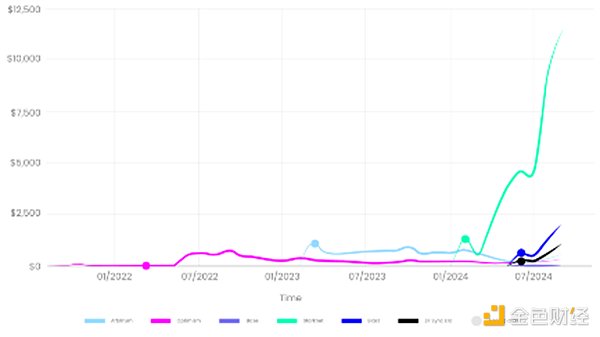
The figure below shows the total cost per user of each L2 chain and shows three main patterns.

For the first batch of L2s like Arbitrum and Optimism, the cost per user will rise significantly due to airdrops. Over time, this cost has dropped significantly as incentives such as airdrops or grants have decreased, but the impact of these incentives has not disappeared, and more users have joined the network. Arbitrum and Optimism have effectively managed their per-user costs to remain stable at $560 for Arbitrum and $304 for Optimism (latest values). Their strategies include recurring grants and multiple rounds of airdrops (in the case of Optimism), thereby maximizing user retention and maintaining a stable user base after the airdrops. This success is also due to a strong ecosystem and numerous dApps (such as Gmx, Aave, Velodrome, etc.) that are able to maintain user stickiness over the long term.
The second pattern is that the incentive cost initially spikes due to airdrops, and then continues to grow, not because of more incentive activities, but because of a rapid decrease in monthly active users. This happens because users have been "farming" before the airdrop distribution and then abandon the chain, resulting in a decrease in the number of users and a higher cost per user, as shown in Figure 3. Due to high valuations from their Token Generation Events (TGEs) and rapid user exits after airdrops, ZK Sync, Starknet, and Blast cost $1,102, $11,486, and $2,000 per user, respectively.
Meanwhile, Base’s costs are very low, less than 10 cents per user. This high efficiency stems from two key factors: Base has not issued its own token, and the chain has attracted a large number of users.
Base has not officially announced any airdrops. They do have incentives, such as grants of over $1 million to builders using ETH or stablecoins, but this is minuscule compared to other chains. This is 362x less than the total incentives distributed by Blast and 633x less than ZK Sync Era. Even without considering airdrops and focusing only on grant programs, it is still 100x less than Optimism’s grant volume.
Across the 6 analyzed chains, the cost is about $2,577 per MAU.
6Key Insights
Airdrops primarily reward users who interact with the platform before the airdrop, stress-test the network, and generate revenue. In contrast, grant programs are designed to bootstrap a protocol, retain users for a long time, create a culture, and build a flywheel ecosystem (token gravity).
Of all incentives, more than 90% of incentives are airdrops, and the rest are long-term grant activities for developers and builders.
Most Layer 2s do not have a net positive return because their expenses are greater than their revenue, mainly due to the allocation of large airdrops at high token issuance valuations.
- The incentive goal is not to generate profits above costs.
- Base is the only L2 that generates more revenue than incentives due to many factors: smooth developer onboarding, culture, airdrop speculation, Coinbase reputation, competitive transaction fees.
- Older L2s have lower cost per user due to: historical security (time-tested and multi-audited…); network effects: recurring grant programs foster network effects for these L2s. Over time, they attract builders and applications, thus fostering a unique community around the L2, creating a self-sustaining innovation growth loop.
Base is a unique isolated case. They focus on providing traceable, relatively small grants to founders, prioritizing culture over incentive activities.
Besides Base, Optimism is currently the chain with the lowest cost per monthly active user at $304. This can be explained by multiple rounds of airdrops and builder grants, which help retain users and bootstrap on-chain use cases.
 JinseFinance
 JinseFinance
 JinseFinance
 Wilfred
 JinseFinance
 JinseFinance
 JinseFinance
 Huang Bo
 JinseFinance
 JinseFinance
 TheBlock