Author: Michael Nadeau, founder of The DeFi Report; Translation: Golden Finance xiaozou
1, Macro Data Update
Economic Recession or Peak and Fall?
In this section, we will introduce some macro-environment related data and its significance to the market.
1.Global Liquidity
Global liquidity is rising, and it seems that this momentum will continue until the first half of 2025.
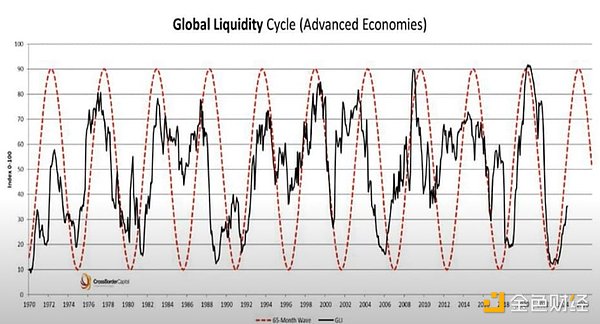
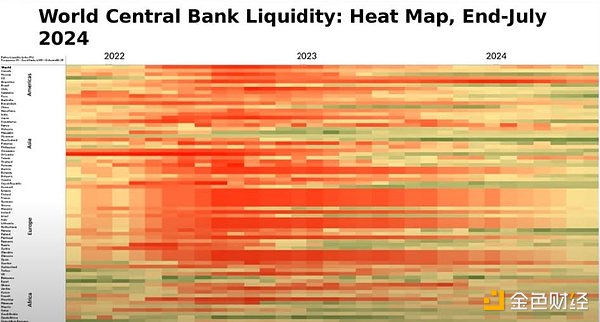
Central banks around the world are turning dovish (less deficits in 2024 = more liquidity).
The following chart shows the net share of central banks that have implemented monetary tightening policies:
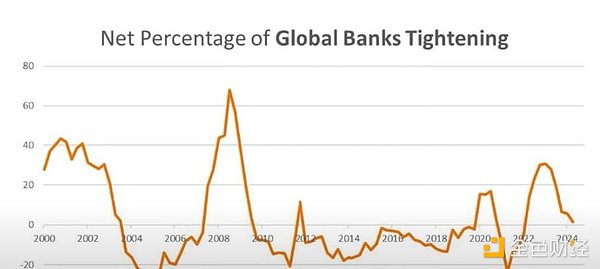
Summary: Global central banks appear to be engaged in a coordinated easing campaign, with the Federal Reserve expected to cut interest rates in September.
2.Business cycle
The chart below is the ISM index for manufacturing conditions, such as new orders, production, employment, supplier deliveries and inventory.
This indicator appears to be bottoming out: the business cycle has bottomed out, unemployment is rising (4.3%), and inflation is falling (1.47% according to Truflation).
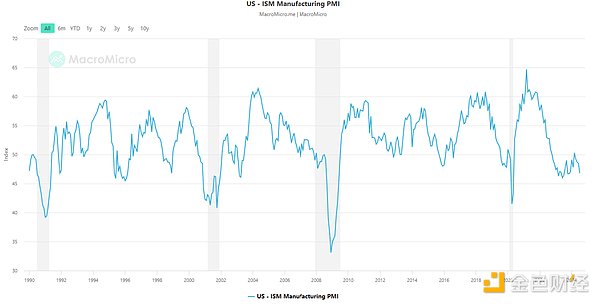
Summary: The bottom of the ISM index is usually accompanied by a recession (grey bars in the figure above). However, fiscal spending comes from the Treasury Department and we do not see signs of a recession - we will discuss this later in this article.
3.Credit Markets
Below is the net share of US banks that tightened their lending standards.
Currently, less than 12% of the banks surveyed are tightening lending standards and therefore see no signs of a recession.

The following figure shows the credit interest Bad:

3.US Dollar
After peaking at 112 in October 2022 (coinciding with the bottoming of global liquidity), the DXY Dollar Index is now trading at 101.
With the Fed’s shift in monetary policy, we expect the downward trend to continue, with the DXY Index falling to 90-95 by 2025.

Summary: Further declines in the dollar could benefit hard assets such as Bitcoin and gold. If Bitcoin performs well, we expect altcoins and crypto markets to generally outperform traditional assets.
4.Fiscal Policy
As mentioned earlier, the federal government continues to spend money it doesn't have in its pocket. In July alone, it accumulated a deficit of $244 billion.
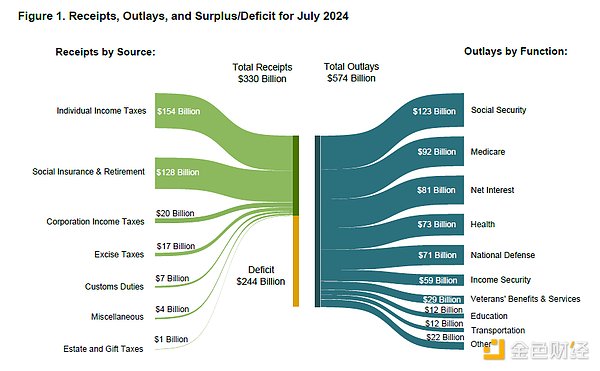
Meanwhile, the projected annual budget deficit recently increased to $1.8 trillion from $1.6 trillion in June.
It's hard for the economy to have a recession when the Treasury is injecting money like this.
5.Fed Forward Guidance
Summary of Fed Chairman Jerome Powell’s Jackson Hole speech:
Inflation: Powell expressed confidence that inflation has been successfully controlled and the 2% target is within reach.
Unemployment rate: With the unemployment rate rising to 4.3% (3.8% in August 2023), the Fed’s focus seems to have shifted from fighting inflation to maintaining a strong labor market. Our guess is that the Fed is closely watching the Sahm Rule - when the 3-month moving average of the unemployment rate rises 0.5% or more from the lowest point in the previous 12 months, a recession will be triggered. The figure was 0.53% in July.
Imminent rate cut: Powell will undoubtedly cut interest rates in September. Meanwhile, futures markets are pricing in nine rate cuts by the end of 2025, with a final rate of 3%.
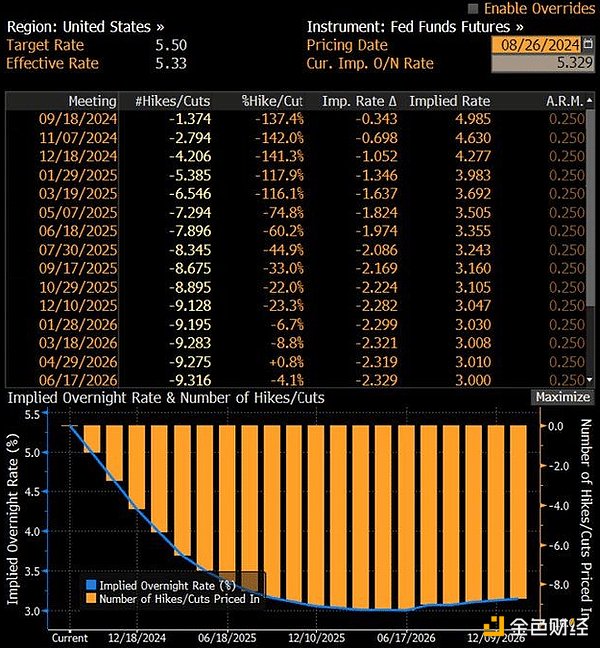
Brief Summary: If Bitcoin can trade at $73,000 at a 5.5% Fed Funds rate, what do you think it will trade at when rates drop to 3%? We think Bitcoin will go higher, with some volatility.
6.Summary
These days, the pundits have been on the fence, but it’s hard to see any signs of an impending recession.
What we’re seeing are signs of fiscal spending, currency debasement, and increased global liquidity—signs that should be bullish for risk assets like cryptocurrencies as we head into the second half of this year and as we head into 2025.
Now, let’s move to the chain and see what investor behavior can tell us.
2On-chain data
As always, we use BTC to measure everything that happens on the chain. Why?
Because Bitcoin is still the ancestor that drives the rest of the crypto market. Until this changes, we intend to use BTC as our reference point.
1.Long-term holders
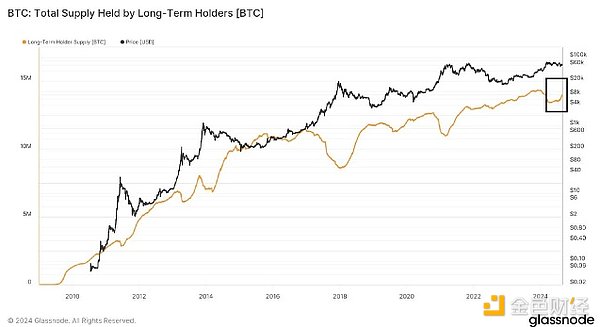
We saw long-term holders of Bitcoin, the "smart money", take some profits at the end of Q1 and Q2 as the yellow line above turned down. So far, the market has been volatile for about 5 months (including two 20%+ drawdowns and one 30%+ drawdown).
Over the past few weeks, we have been seeing initial signs that long-term holders have returned to the market as buyers.
Summary: Smart investors think we are bullish on Bitcoin?
2.MVRVRatio
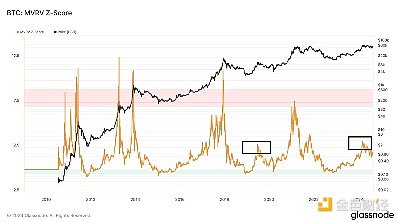
In March, Bitcoin's MVRV (market value to realized value ratio, representing the cost basis market value of all Bitcoins in circulation) reached 3 (moderately overbought).
We reached a similar level in mid-2019, then readjusted and finally peaked at 7.5 in 21.
The current MVRV ratio is 1.6, neither overbought nor oversold.
Will we see a repeat of 2019, with greater volatility later this year in the first quarter? Stay tuned, we will share our conclusions in a later report.
3.Realized Price
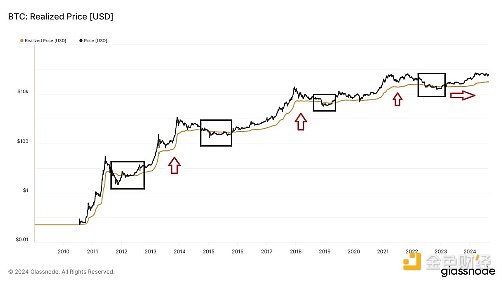
The realized price of Bitcoin (the yellow line in the above chart - representing the cost basis per Bitcoin in the network) is currently $31,000. As we can see from the red arrows, realized prices have had a lot of swings in past cycles:
During the 2017 cycle, realized prices rose over 1,000%.
During the 2021 cycle, realized prices rose 242%.
In the current cycle, realized prices have only risen 55%.
The most recent 55% move has been in the range we saw in 2019, followed by a period of consolidation and ultimately a parabolic move in late 2020 and into 2021.
4.Bitcoin Miners
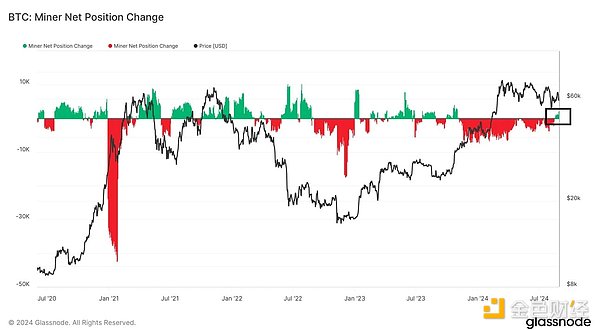
The above chart shows the overall change in the 30-day net position of Bitcoin miners. The green part of the upper part of the chart indicates that the BTC accumulation of Bitcoin miners in nearly a year has exceeded their BTC sales for the first time. We are closely watching this trend.
Coupled with the German government's sale of $2.5 billion in BTC in July, miners' shift from net sellers to buyers may stabilize the market and lay the foundation for the next wave of upward movement.
5.Funding Rate
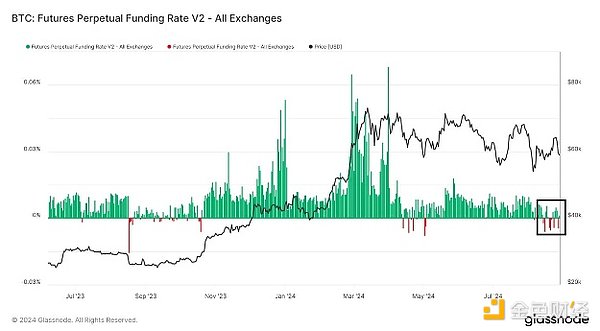
Funding rates can give us a sense of market sentiment (and leverage). As we can see, sentiment peaked at the end of Q1 (with a funding rate of 6.8%), and recently the data has actually turned negative.
For reference, the peak funding rate for the 2021 cycle was 16.6%.
Bottom line: While it may seem paradoxical, it is healthy to see such negative sentiment during a bull market. The market cannot go straight up forever. During the consolidation period, traders experience frequent volatility, become impatient, and eventually turn bearish - creating conditions for a short squeeze.
This is a necessary process, and only when this process ends can we hope to see the arrival of a bull market.
6.Stablecoins
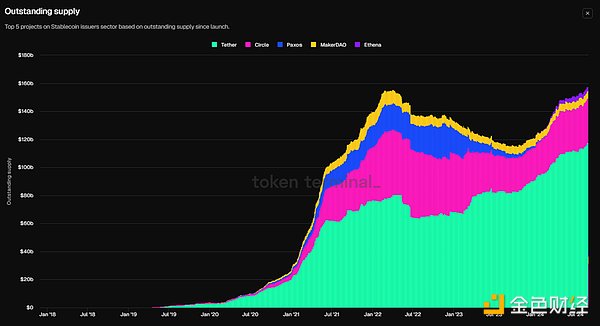
Total stablecoin balances are now just back to their highs at the end of 2021. We believe this is part of the reason why Bitcoin has had difficulty breaking through its all-time highs.
There is not enough liquidity in the system.
The upcoming rate cuts and increasing liquidity suggest that stablecoin balances will move to the right of the chart as investors are likely to migrate away from money market accounts (currently holding nearly $6.5 trillion).

7.Forced Sellers(Forced Sellers)
We should also mention the recent large number of larger entities selling large amounts of BTC and ETH:
The German government sold $2.5 billion worth of BTC in June and July of this year.
Jump Crypto sold nearly $400 million of ETH in July and August of this year.
To date, Mt. Gox creditors have received about $3 billion, with another $5.8 billion to be distributed (we assume a lot of this was sold, and creditors are likely sitting on huge proceeds).
The court approved a $12.7 billion FTX distribution to customers on August 9th, and all claims of $50,000 or less (98% of claimants) will be paid by October 9th.
Of course, this is all noise in the long run, but we think it is a factor in the consolidation and volatility we have seen this summer. As the selling decreases, a solid foundation may be formed leading to the next bull run.
3Conclusion
In many ways, the trend we saw in Bitcoin from the fourth quarter of last year to the first quarter of this year ($27,000 to $73,000) is similar to what we saw in 2019 ($4,000 to $14,000). In 2019, crypto native users were very excited and thought we would return to historical highs. But the reality is that there were no new users entering the crypto field at that time. In the end, Bitcoin went through a full year of consolidation (and recovery from the panic of the new crown epidemic) and finally broke through the historical high in the second quarter of 2021, reaching $66,000, coinciding with interest rate cuts, currency devaluation, and the election cycle.
After BTC firmly broke through the all-time high, we saw an explosion in the number of new users, countless DAOs, the rise of DeFi, a 10x increase in stablecoin issuance, an explosion of NFTs, and crypto-native users with high confidence and optimism in the cryptocurrency market, showing "WAGMI" sentiment.
If history repeats itself, this frenzy may appear later this year and extend into 2025.
What are the risks?
Recession? In some areas of the economy, such as commercial real estate, it is true. But from a broader perspective, fiscal spending is unlikely to cause a recession.
If Harris wins in November, it may be unfavorable for this cycle, but it will have little impact in the long run.
More fighting in Europe and the Middle East may disrupt the market (again, short-term impact).
Traditional markets are seeing a major correction as the Fed shifts monetary policy amid recession fears. If this happens, the Fed's monetary easing and increased global liquidity will ultimately boost markets in the long run.
We will continue to monitor the data and will be sure to let you know if we turn bearish.
 JinseFinance
 JinseFinance
 JinseFinance
 JinseFinance
 JinseFinance
 JinseFinance
 JinseFinance
 JinseFinance
 JinseFinance
 Finbold
 Bitcoinist